The Compliance Planet software can help you with graphs with the volume and/or value of transactions plotted against the time or period in which they occur. Thus, making financial reporting easier. The software gives an analysis of a selected transaction type over a period of time, here is how to go about it.
NOTE: Only person(s) Assigned right(s) to ‘process CTR reports’ will be able to carry out this Operation.
STEP 1: From the left-hand side menu, click on “NFIU CTR ANALYSIS”. See fig. 2.5a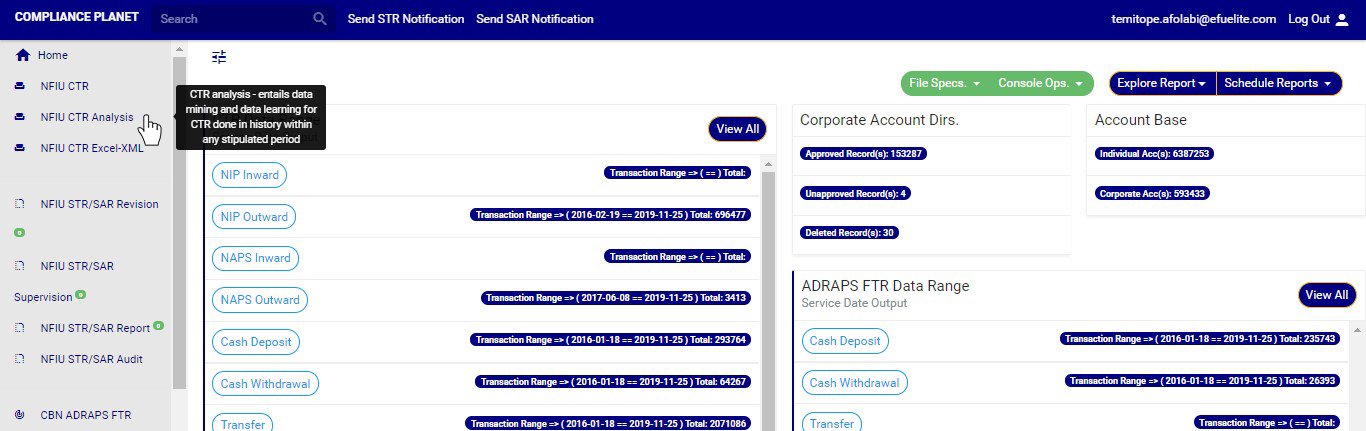
(fig. 2.5a)
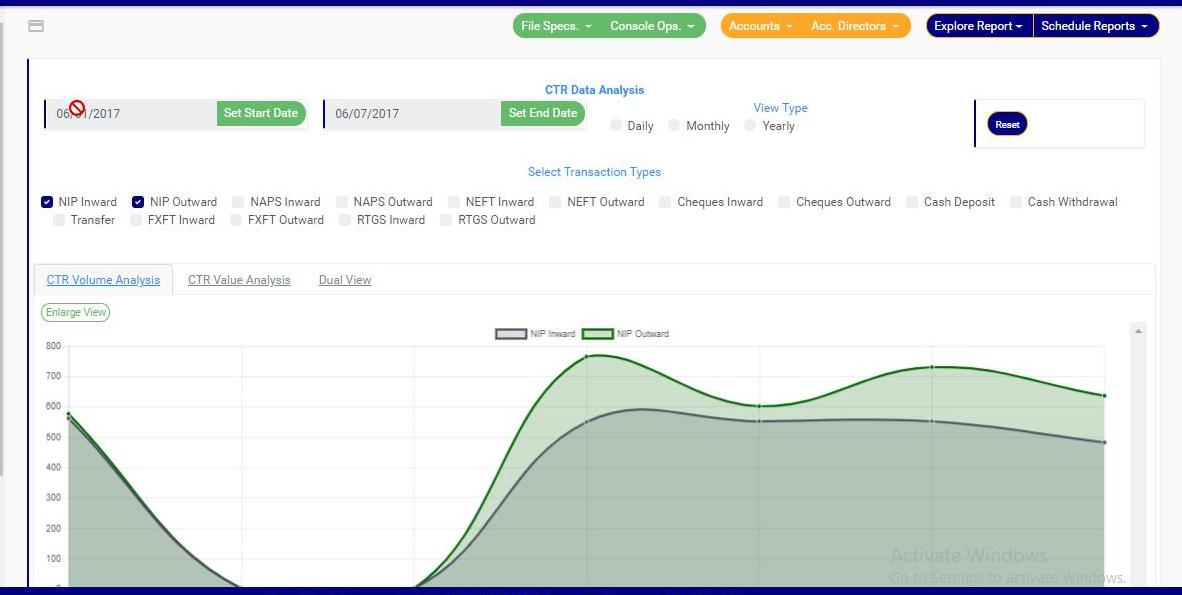
STEP 2: Clicking on NFIU CTR ANALYSIS will display a page as in fig. 2.5b below. On this page, you will find features to set date, select transactions, set different periodic views, enlarge graph view and set parameters of graph.
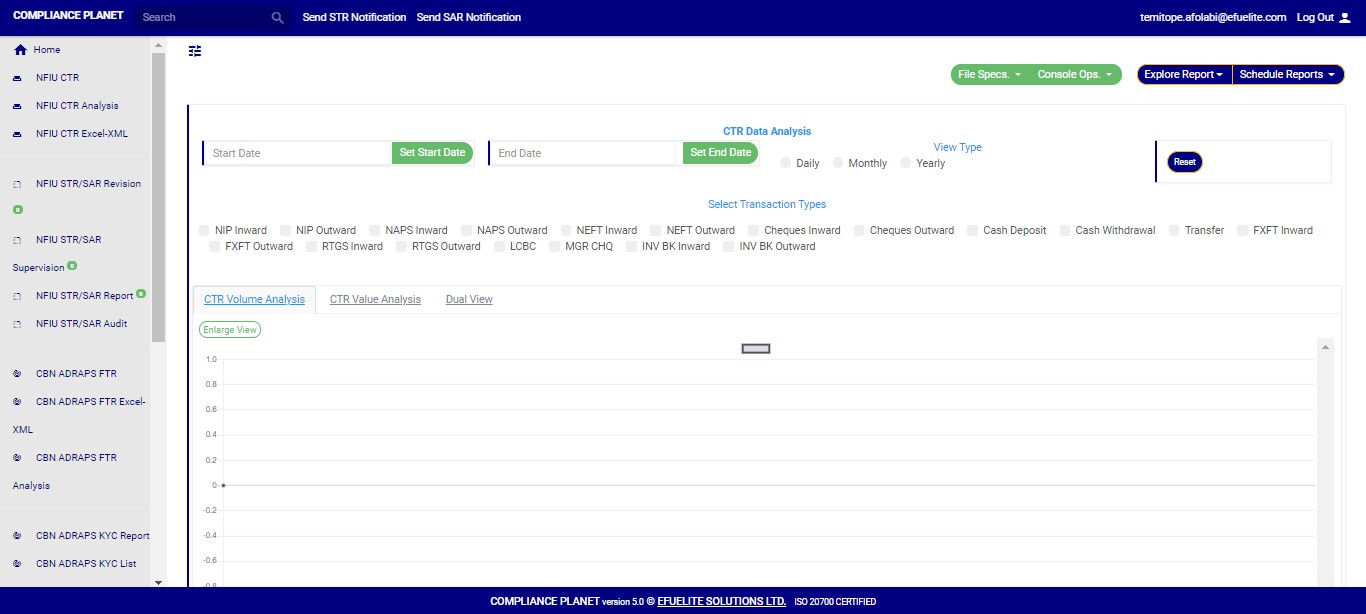 (fig. 2.5b)
STEP 3: Click on SET START DATE and SET END DATE to specify the beginning and the end of the period (respectively) for which you want to see. You must set your date parameters before selecting any transaction type for analysis.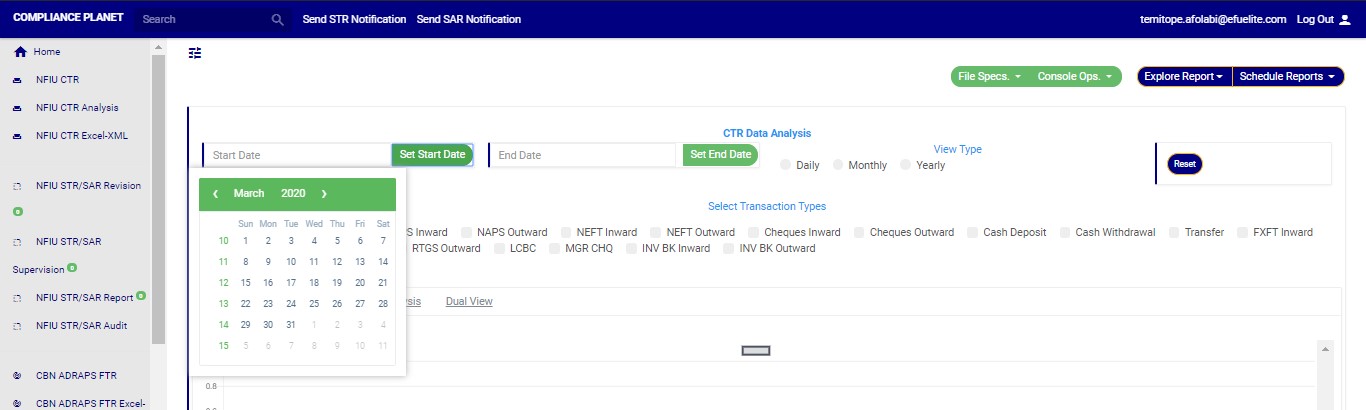
(fig. 2.5c)
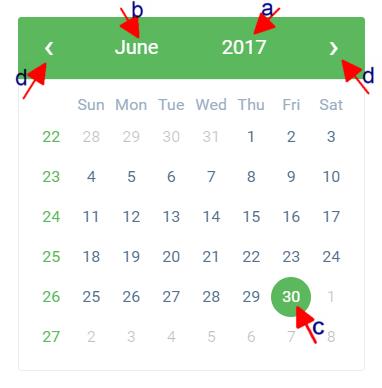
● Take a look at the arrows labelled a to d in fig. 2.5d to study the calendar.
a. Click on the given year to change it to your year of choice.
b. Click on the given month to change it to your month of choice.
c. Then, click on the date of the month.
d. You can also click on the angle brackets on the calendar [ ‘’ ] to go backward or forward.
(fig. 2.5d)
STEP 4: Tick the check boxes to select the transaction type(s). As soon as you select a transaction type, the software processes it and shows you a graph instantly. Fig. 2.5e below is an example for NIP Inward transaction for 1st of June, 2017 to 15th of June, 2016..
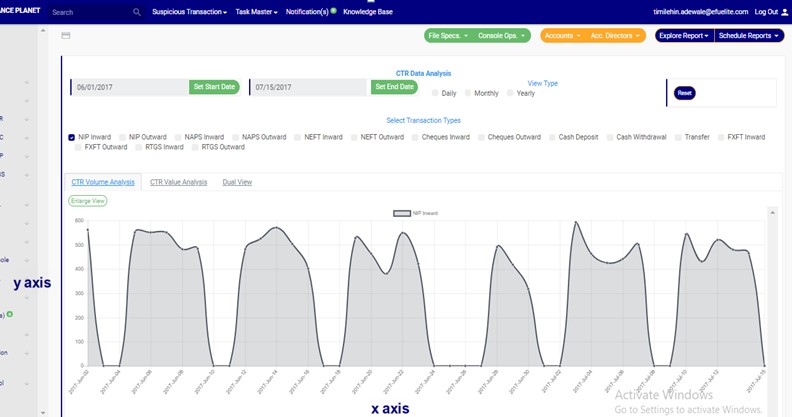
(fig. 2.5e – one transaction type graph)
➔ Looking at fig. 2.5e above, the time or periods are always labelled on the x axis (horizontal axis) and the volume or values of the transactions are always on the y axis (vertical axis). So, from the example in the fig. 2.5e, the software shows that about 500 to 600 ‘NIP Inward’ reporting threshold transactions occurred on the 2nd of June, 2017.
➔ You can see analysis for more than one transaction type. See fig 2.5f and 2.5g to see the analysis for two (2) and three (3) transactions types at the same time on the same graph respectively.
● Two-Transaction Type Graph:

(fig. 2.5f – two-transaction type graph)
● Three-Transaction Type Graph: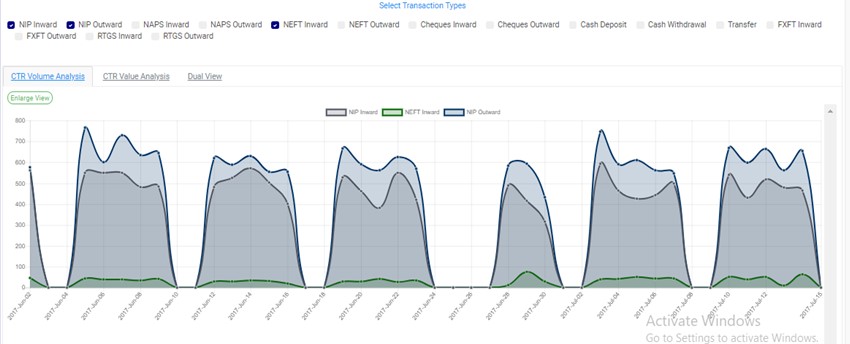
(fig. 2.5g – three-transaction type graph)
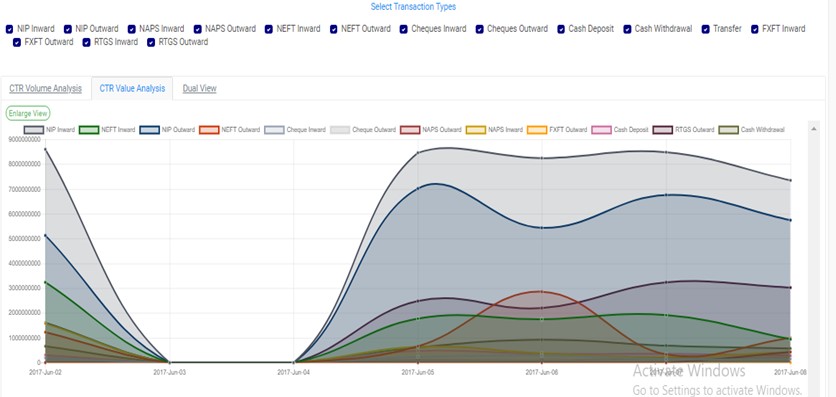
➔ You can check all the boxes if you want to see analysis for all. See fig. 2.5h below to see an example.
➔ You can see a bigger view of your graph by clicking on the Enlarge button. This button is at the top-left side of the graph, above the selected transaction types. Check fig 2.5i and fig. 2.5j to see the Enlarge button and the Enlarged view of the graph respectively.
(fig. 2.5i)
● An enlarged view of the graph: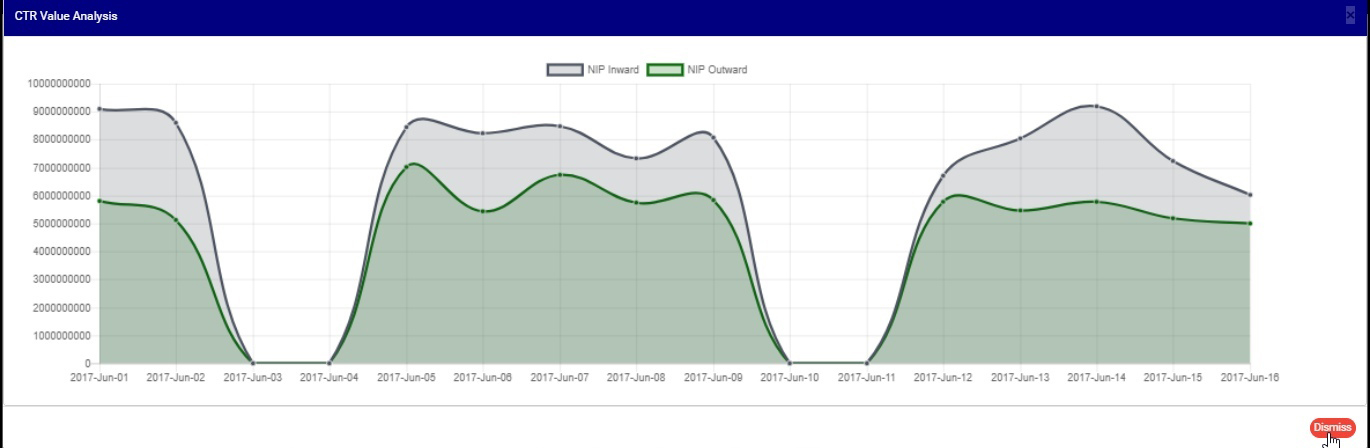
(fig. 2.5j)
➔ From the fig. 2.5j above, you can see a red button at the bottom-right of the console. It is the DISMISS button to close the enlarged view of the graph. clicking it takes you back to the transaction analysis page as in fig. 2.5i.
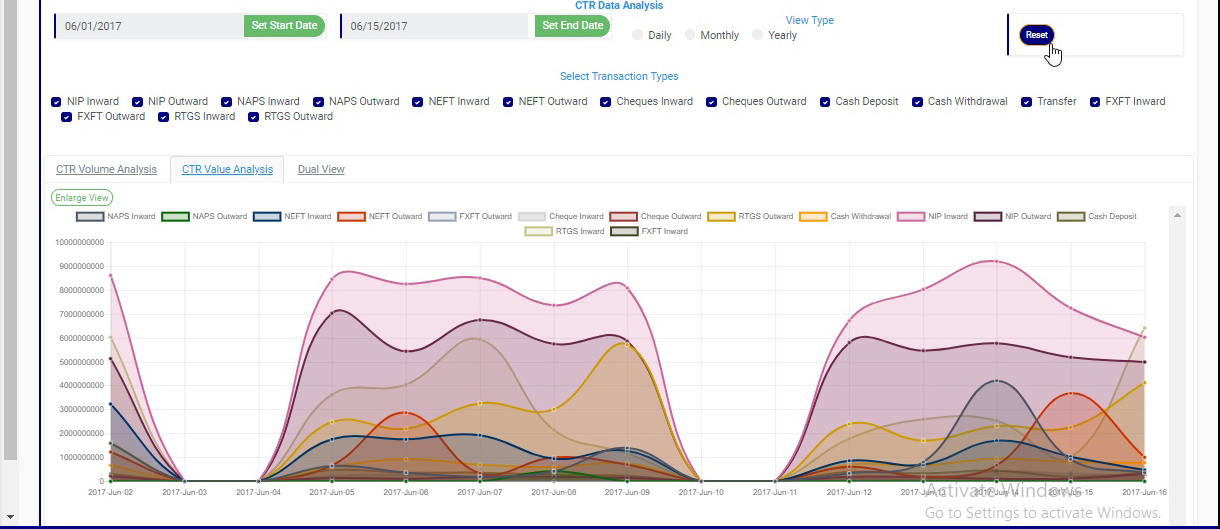
➔ Once you set your start and end dates and select transaction type, you cannot change the date settings by going straight back to the calendar or deselect any transaction type by unchecking its box. You have to click on the Reset button. Check out fig. 2.5k to see the reset button. It is a deep-blue button at the top right area of the transaction analysis page.
(fig. 2.5k)
➔ To hide transactions line on the graph, click on the box just before the name of the transaction type(s) you want to hide and click the box again to re-select. See fig 2.5l and 2.5m to see a graph before hiding one of the transactions and after hiding the transaction type
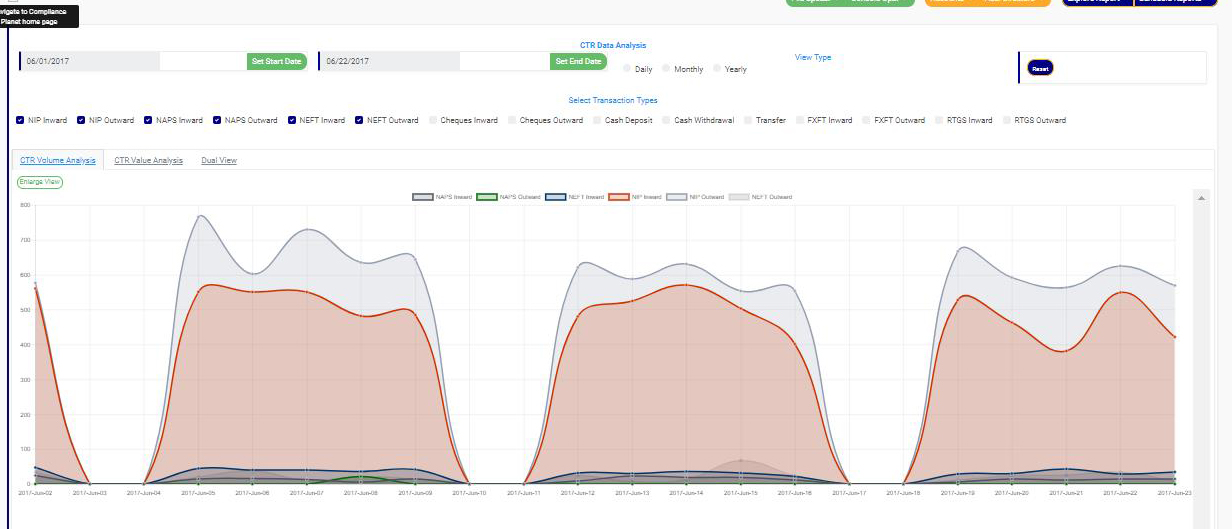
(fig. 2.5l)
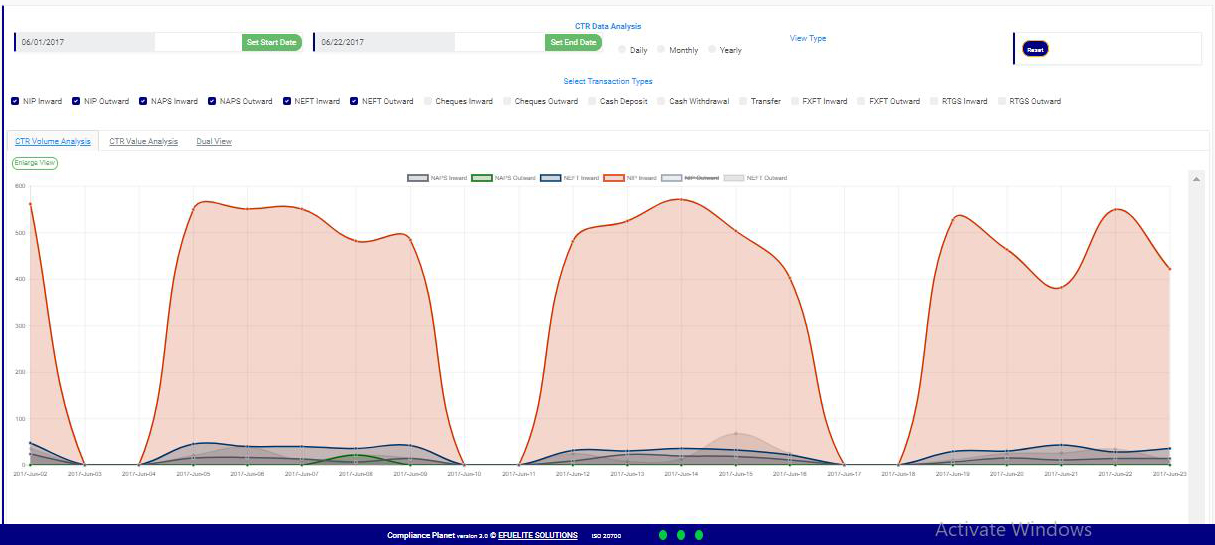
(fig. 2.5m)
STEP 5: Click on DAILY or MONTHLY or YEARLY to change parameter of the time or period. You can switch these view options to see analyses differently. These buttons reset the parameters on the x axis.
➔ By clicking Daily, the value or volume of the transaction type is plotted against each day within the period you specify in your date settings. The default view type is ‘DAILY’.
➔ By clicking Monthly, the value or volume of the transaction type is plotted against each month within the period you specified in your date settings. This will have effect on analyses with date settings that spread to two or more months.
➔ By clicking Yearly, the value or volume of the transaction type is plotted against each year within the period you specified in your date settings . This feature will have effect if the period specified in your date settings spreads to two or more years.
STEP 6: Click on CTR Volume Analysis or CTR Value Analysis or Dual View to see analysis based on volume of transactions or value of transactions or value and volume together, respectively. The volume analysis button and the value analysis button only change parameters on the y axis to number or amounts.
➔ By clicking on the CTR Volume Analysis, the graph analysis will be according to the number of the transactions that occurred in the period you specified in your date settings. Look at fig. 2.5n below for an example on NIP Inward volume analysis.
(fig. 2.n)
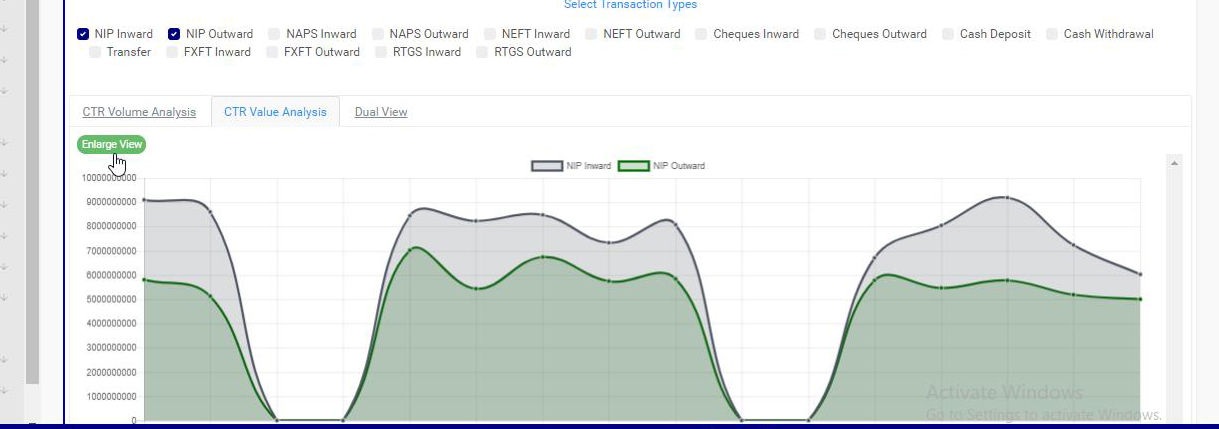
➔ By clicking on the CTR Value Analysis, the graph analysis will be according to the amounts (in naira) of the transactions that occurred in the period you specified in your date settings. Look at fig. 2.5o below for an example on NIP Inward value analysis.

(fig. 2.5o)
➔ By clicking on the Dual View, the software places both analysis, that is both volume and value, side by side.
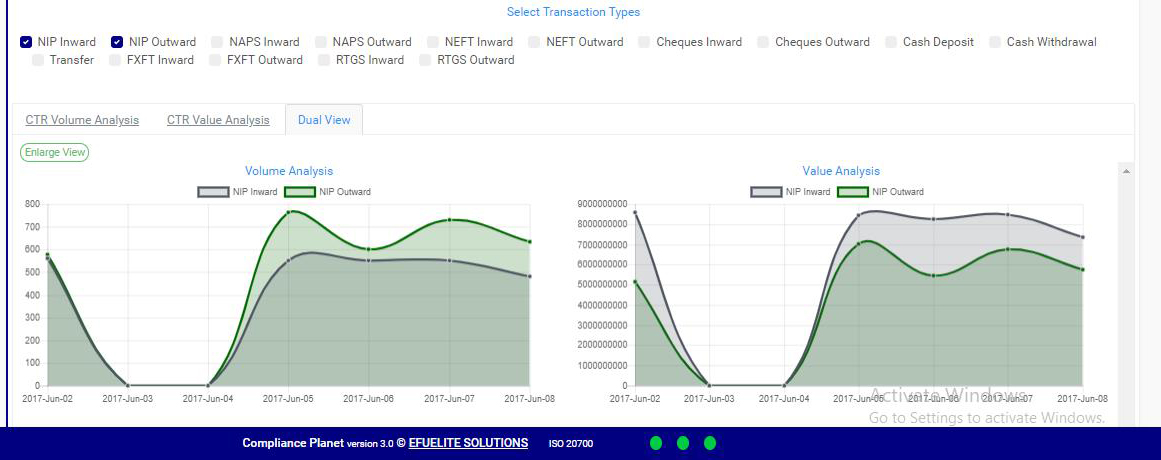
(fig. 2.5p)
