Here, the Software can generate graphs with the value and/or volume of transactions plotted against the time or period in which they occur. To get the software to give you an analysis of any ADRAPS FTR type over a period of time, here is how to go about it.
NOTE: Only person(s) profiled and assigned right to ‘View FTR Reports’ will be able to carry out this operation.
STEP 1: From the left hand side menu, click on CBN ADRAPS FTR Analysis as in fig. 3.6a below.
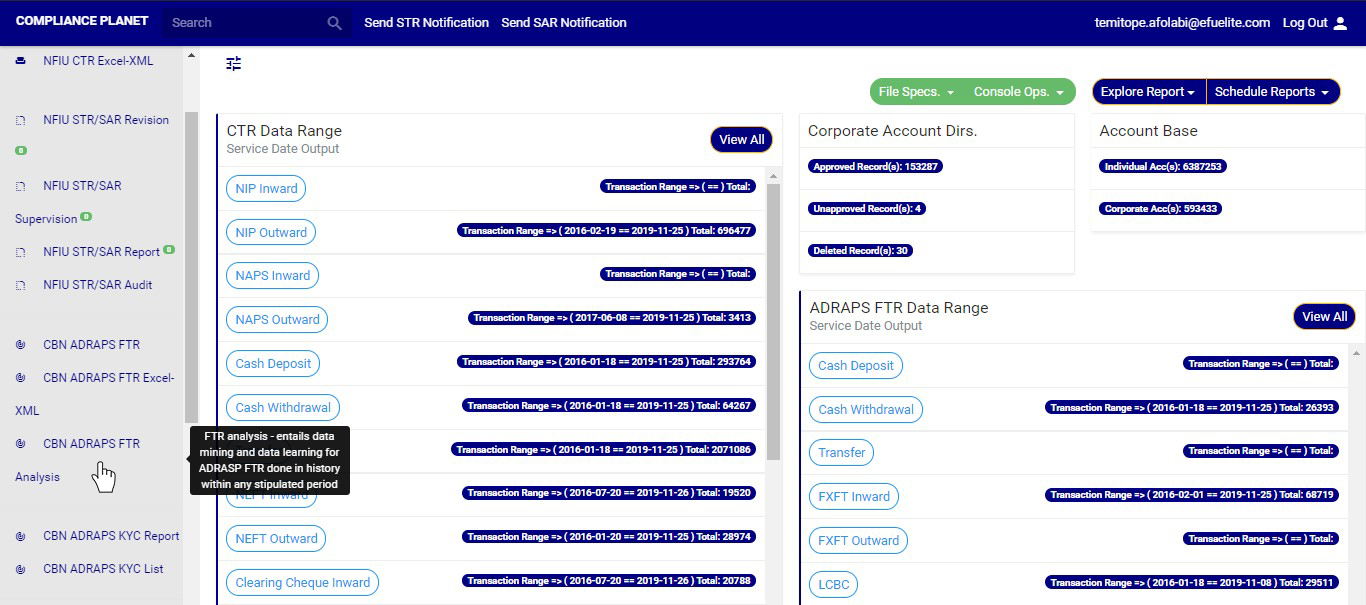
This displays a page as in fig. 3.6b below.
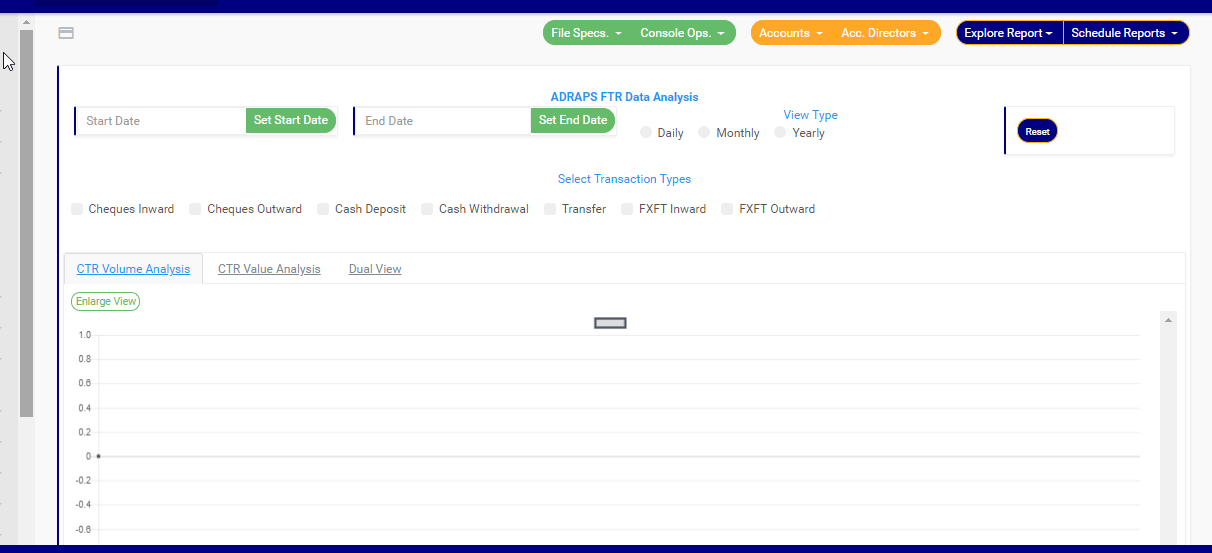
STEP 2: Click on SET START DATE and SET END DATE to specify the beginning and the end of the period (respectively) for which you want to see. You must set your date parameters before selecting any transaction type for analysis. Take a look at fig. 3.6c to see how to set the date. Fig. 3.6d shows a labelled calendar next.
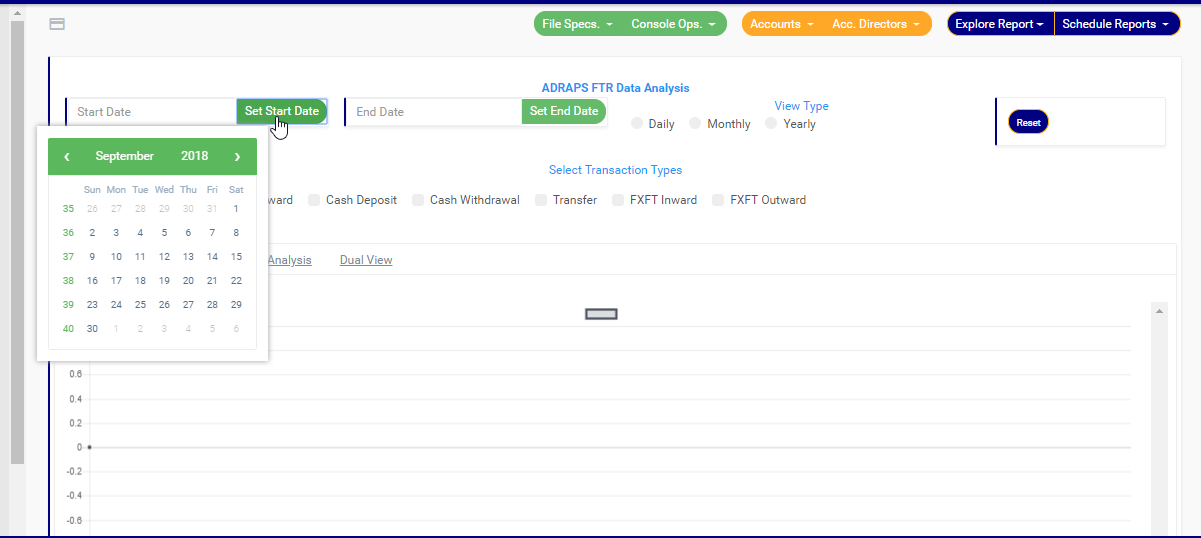
(fig. 3.6c)
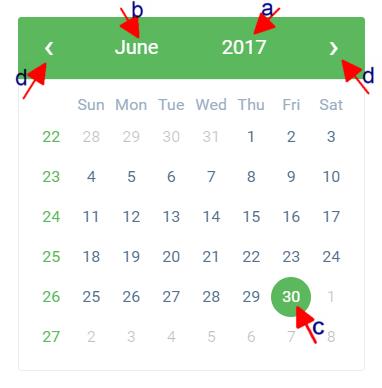
Take a look at the arrows labelled a to d in fig. 3.6d to study the calendar.
a. Click on the given year to change it to your year of choice.
b. Click on the given month to change it to your month of choice.
c. Then, click on the date of the month.
d. You can also click on the angle brackets on the calendar [ ‘’ ] to go backward or forward.
STEP 3: Tick the checkbox ◻ of the FTR type(s) you want to view. As soon as you select a transaction type, the software processes it and displays a graph instantly. Fig. 3.6e below is an example for Cash Deposit ADRAPS FTR for 1st of June 2017 to 30th of June 2016.
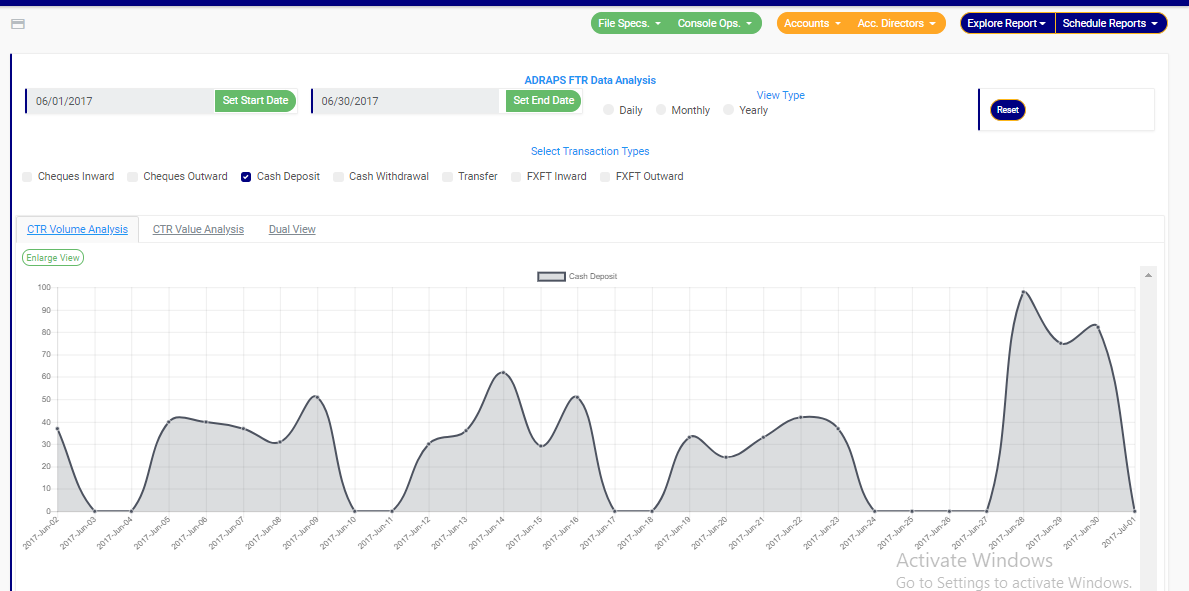
(fig. 3.6e)
➔ Multiple transaction type can be selected. You can select all if you wish. See fig. 3.6f below for an example of a graph having analysis for more than one transaction.
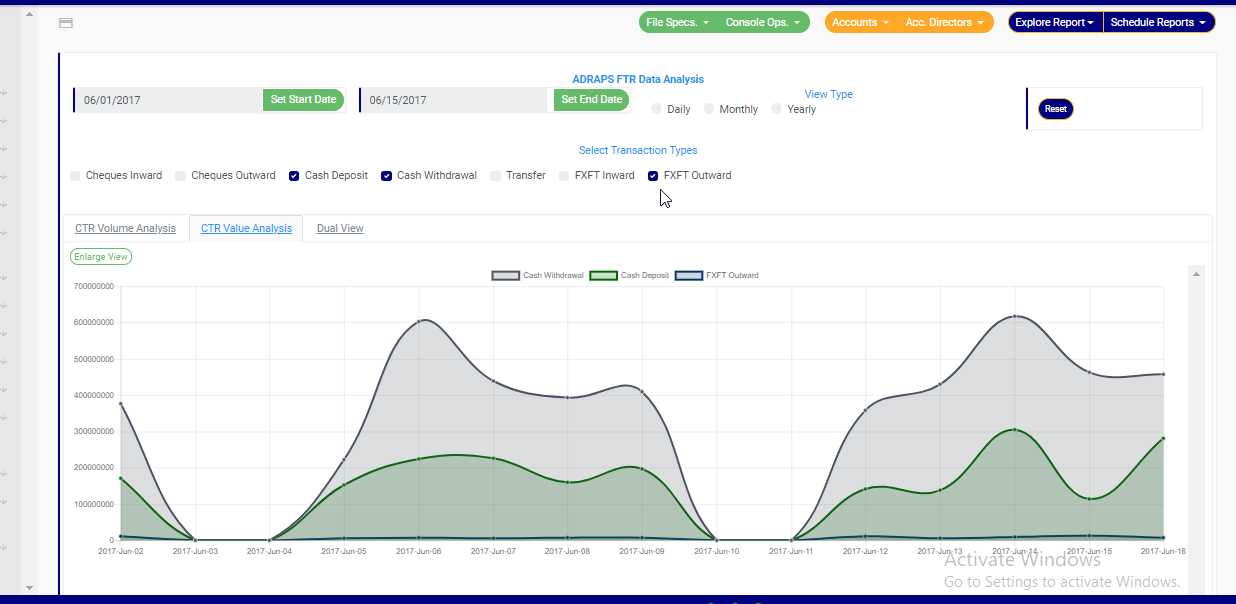
(fig. 3.6f)
➔ ADRAPS FTRs can be analysed by the volume of the selected transactions or the value of the selected transactions. The Volume analysis is the default analysis . However, you can view both analysis side by side.
➔ By clicking on the CTR Volume Analysis, the graph analysis will be according to the number of the transactions that occurred in the period you specified in your date settings. Look at fig. 3.6e above for an example.
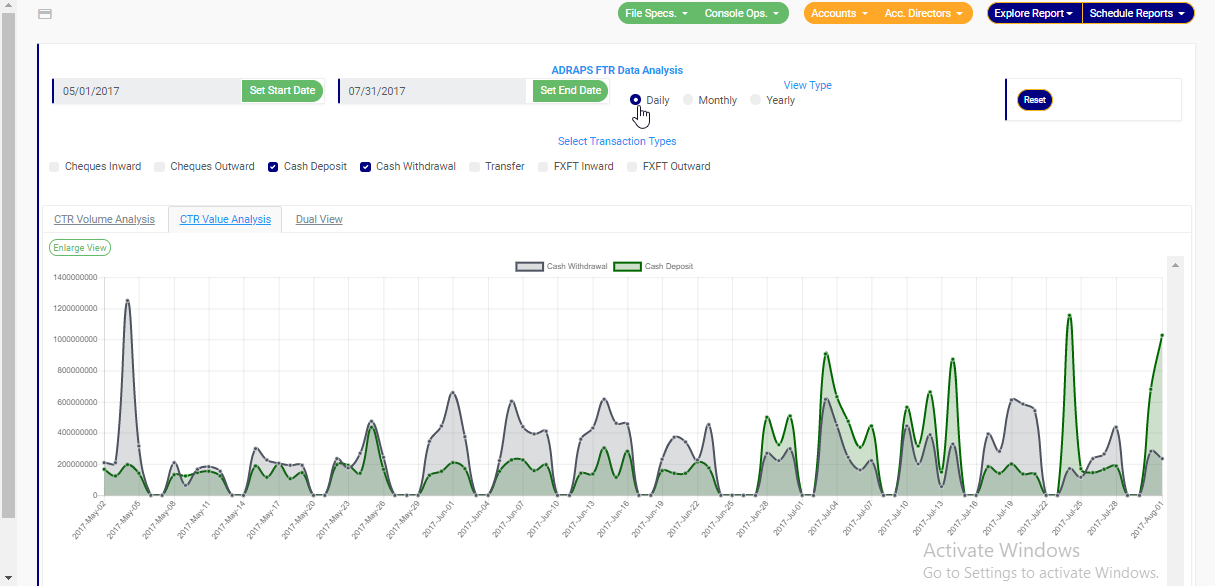
➔ By clicking on the CTR Value Analysis, the graph analysis will be according to the amounts (in naira) of the transactions that occurred in the period you specified in your date settings. Look at fig. 3.6g below for an example on value analysis.
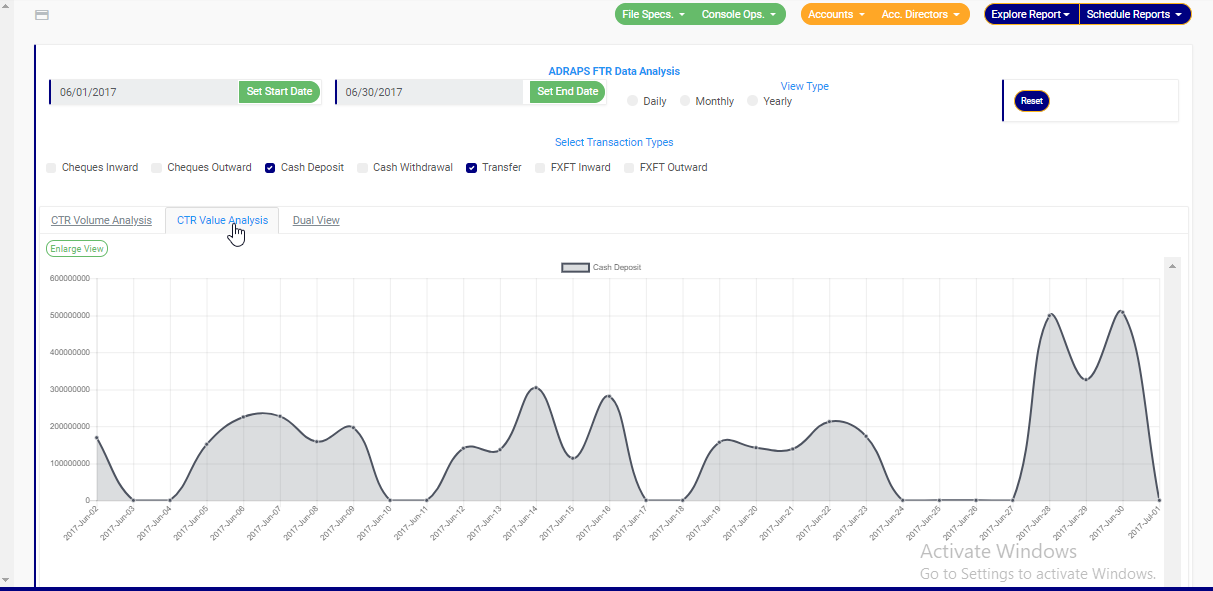
(fig. 3.6g)
➔ By clicking on the Dual View, the software places both analysis, that is, volume and value, side by side. See an example of a dual view in fig. 3.6h.

(fig. 3.6h)
➔ To see a bigger view of your graph, click on the ENLARGE button. Check out fig. 3.6i to see the button. It is a green button right under the CTR Volume Analysis, CTR Value Analysis and Dual View switches.
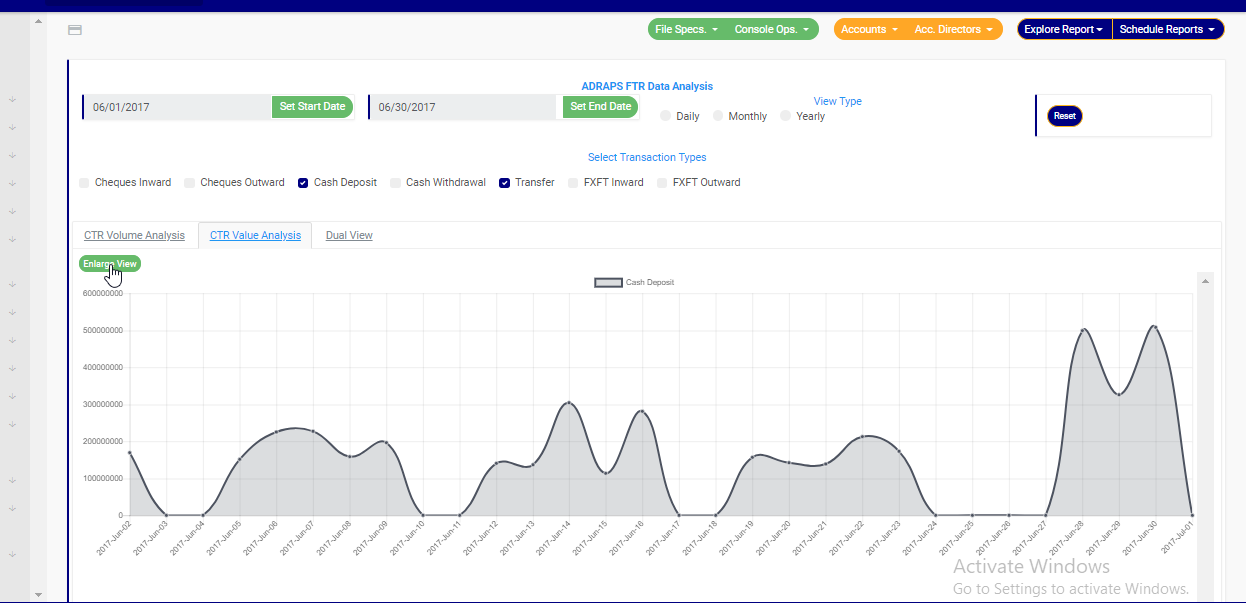
(fig. 3.6i)
➔ See fig. 3.6j and fig. 3.6k for an enlarged view of a graph (one analysis) and an enlarged view of two graphs together (dual view of the value and volume analysis) respectively.
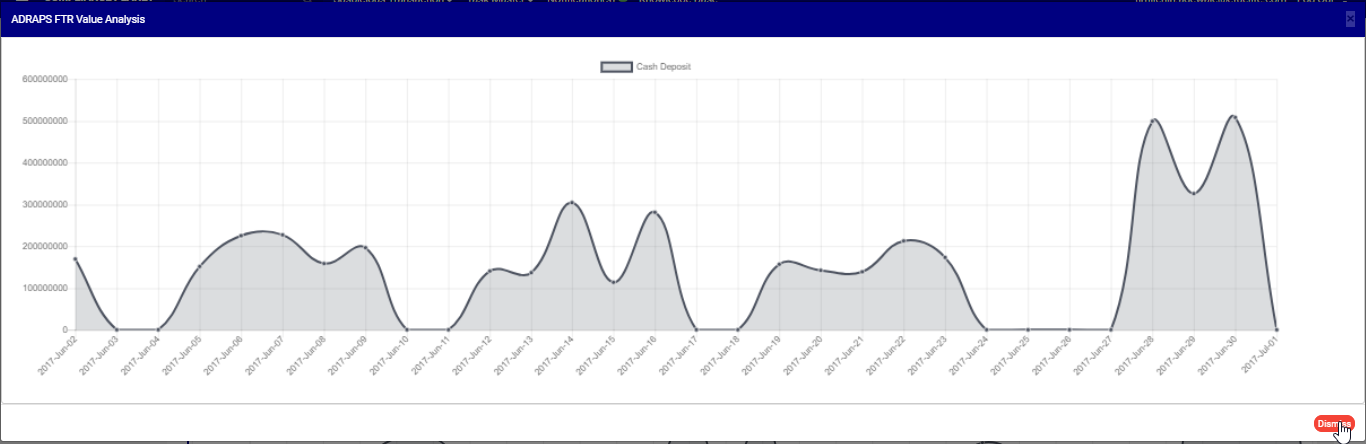
(fig. 3.6j)
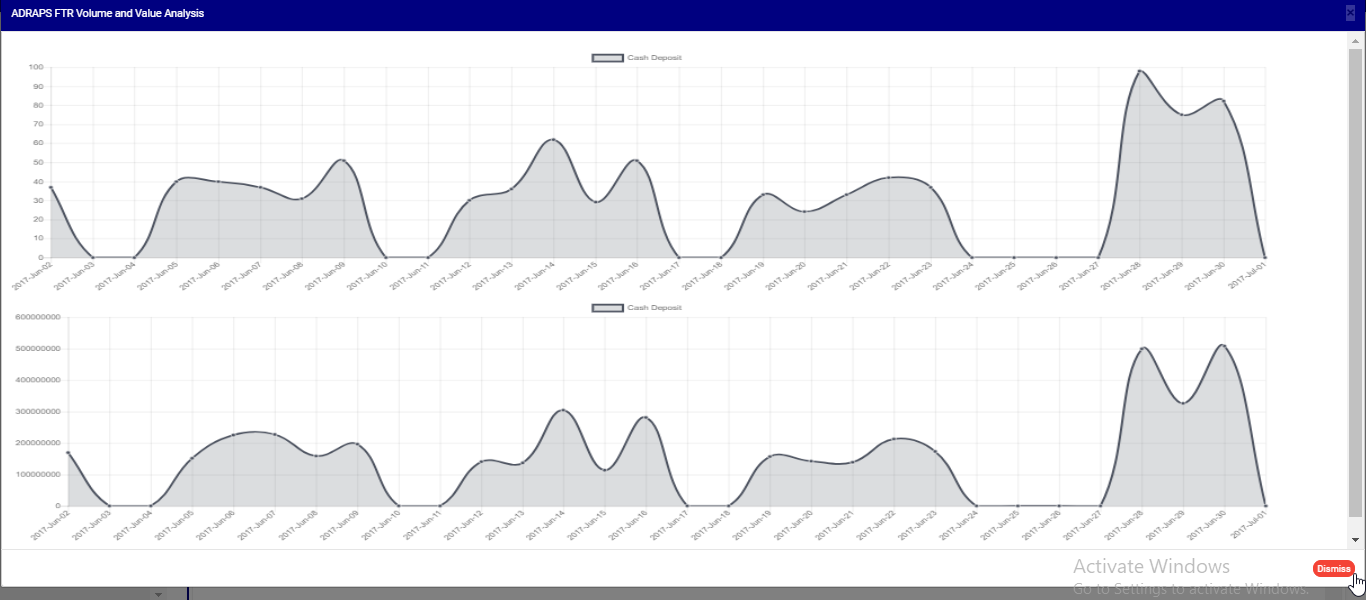
(fig. 3.6k)
➔ There is a red ‘DISMISS” button at the bottom-right corner of the graph console. It is for closing the console. Click on it as in fig. 3.6k above and the enlarged view will be closed.
STEP 4: Click on DAILY or MONTHLY or YEARLY to change the time or period parameter. You can switch these view options to see analysis differently. These buttons are next to the End Date button on the page. See fig. 3.6l below to view them.
➔ By clicking Daily, the value or volume of the transaction type is plotted against each day within the period specified in the date settings. This is the default view setting on the software for every analysis.
➔ By clicking Monthly, the value or volume of the transaction type is plotted against each month within the period specified in the date settings. This will have effect on analysis with date settings that spread to two or more months.
➔ By clicking yearly, the value or volume of the transaction type is plotted against each year within the period specified in the date settings. This feature will have effect if the period specified in your date settings spreads to two or more years.
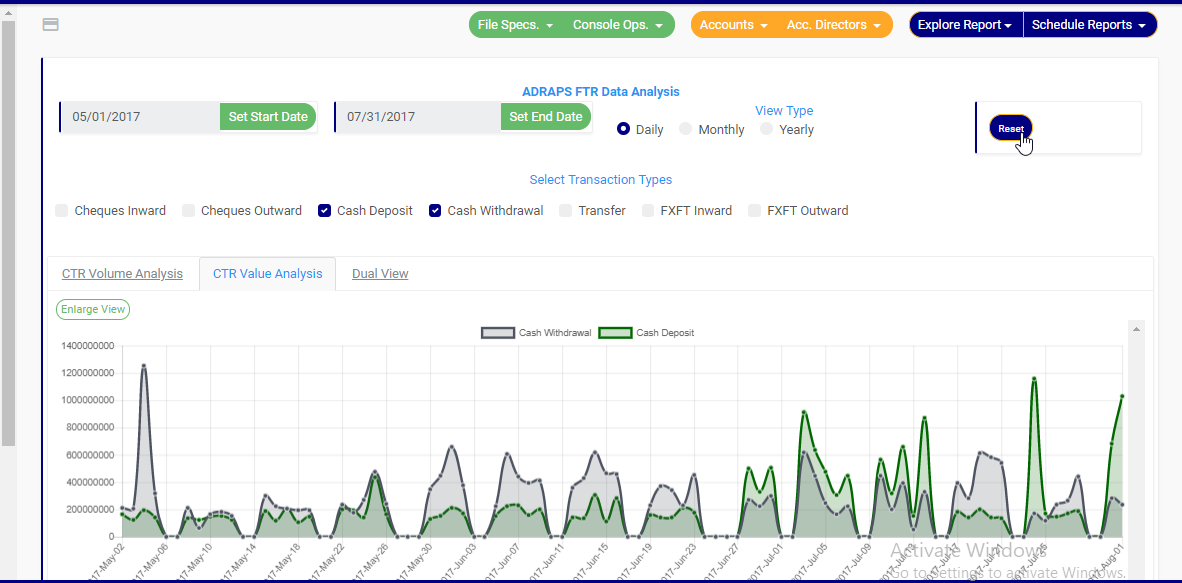
➔ Once you select any start date, end date and you mark any transaction for analysis, the software processes the details of the transaction selected right away, so, you cannot undo any setting you have made. You can only switch between volume and value analysis and change your view type. To make new settings for a fresh analysis, click on the RESET button. The software will clear previous selections. See fig. 3.6l below to view the Reset button. It is next to the View Type buttons
(fig. 3.6)
For further enquiries :
Tel +234(0) 816 555 9818
Email solutions@efuelite.com
Web http://solutions.efuelite.com
