This operation involves the download of foreign transaction reports. The processes and operations under this report are similar to those of CTR FTR Report.
NOTE: Only person(s) profiled and assigned right to ‘Process FTR Reports’ will be able to carry out this operation.
Here is how to schedule and download ADRAPS FTR.
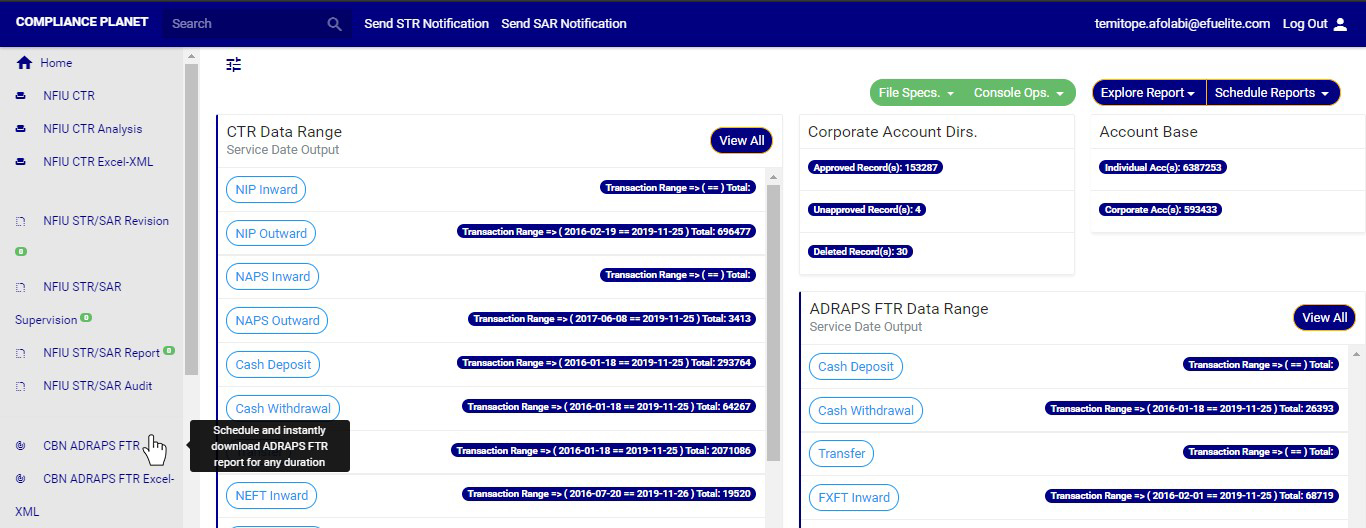
STEP 1: From the main dashboard, click on reports. (See fig. 3.4a)

(fig. 3.4a)
(fig. 3.4 b)
(fig. 3.4c)
STEP 3:Click on SET START DATE and SET END DATE to specify the beginning and the end of the period (respectively) for which you want to generate report. A calendar drops below the date box as in fig. 3.4d.
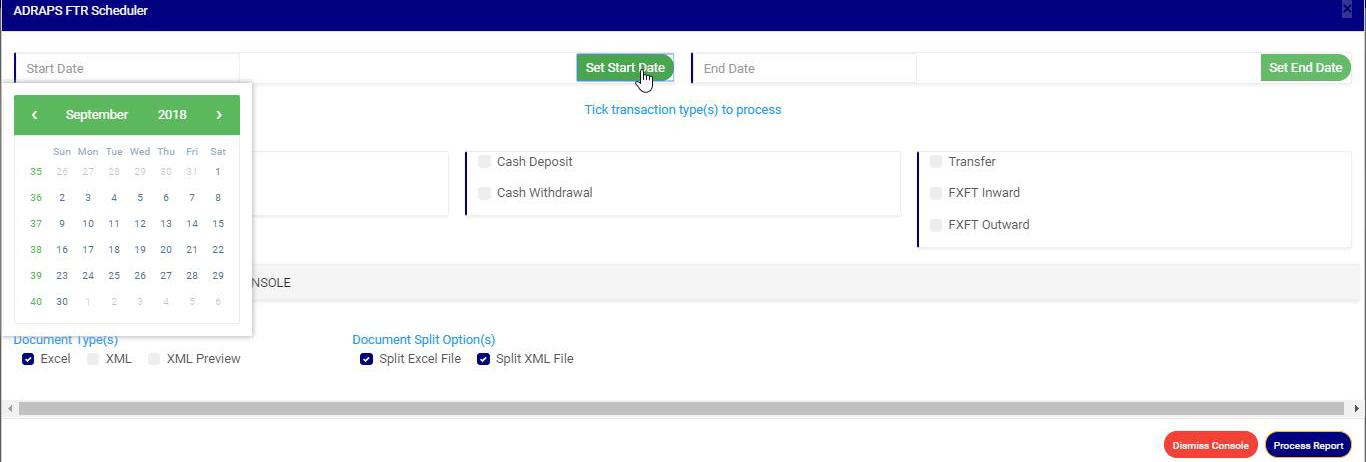
(fig. 3.4d)
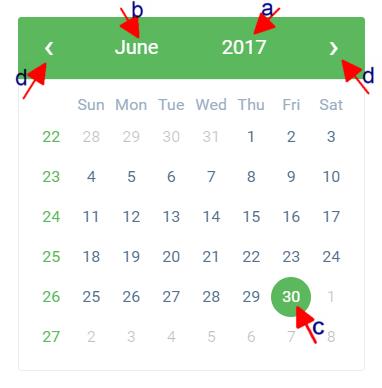
Take a look at the arrows labelled a to d in fig. 3.4e to study the calendar.
a. Click on the given year to change it to your year of choice.
b. Click on the given month to change it to your month of choice.
c. Then, click on the date of the month.
d. You can also click on the angle brackets on the calendar [ ‘’ ] to go backward or forward.
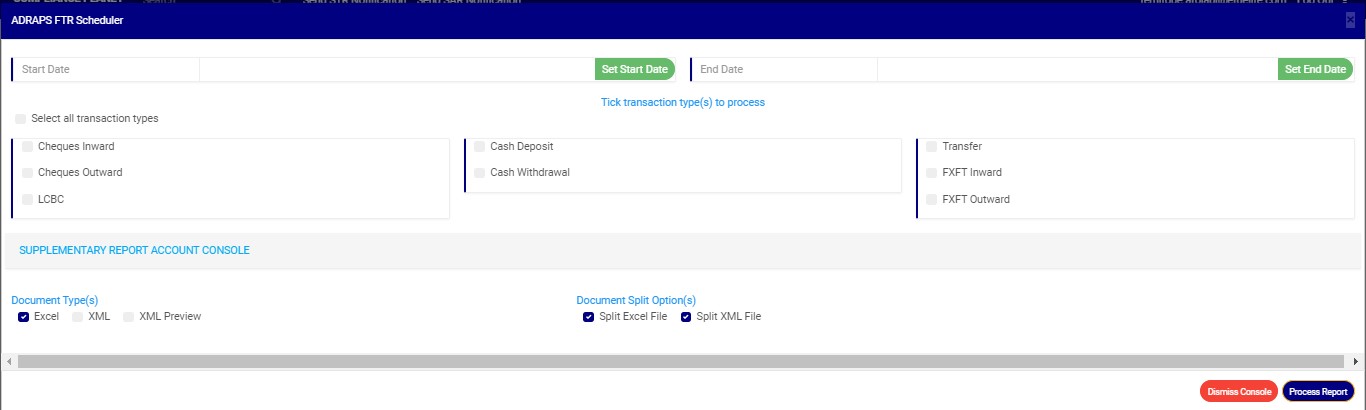
STEP 4: Click on the check boxes to select the transaction(s). You can select one or more as in fig. 3.4f.
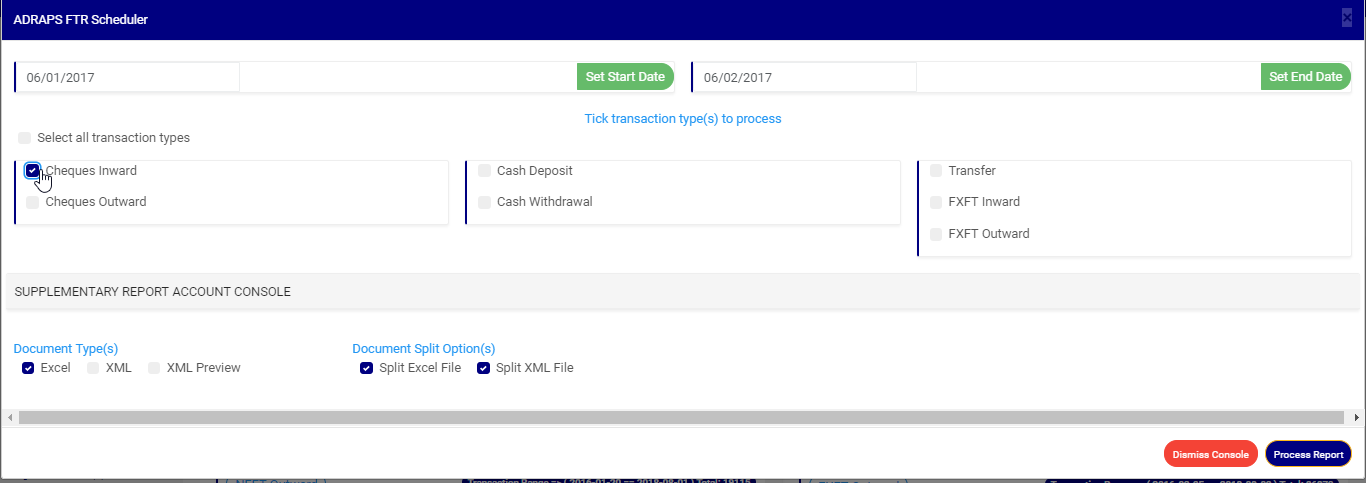
(fig. 3.4f)
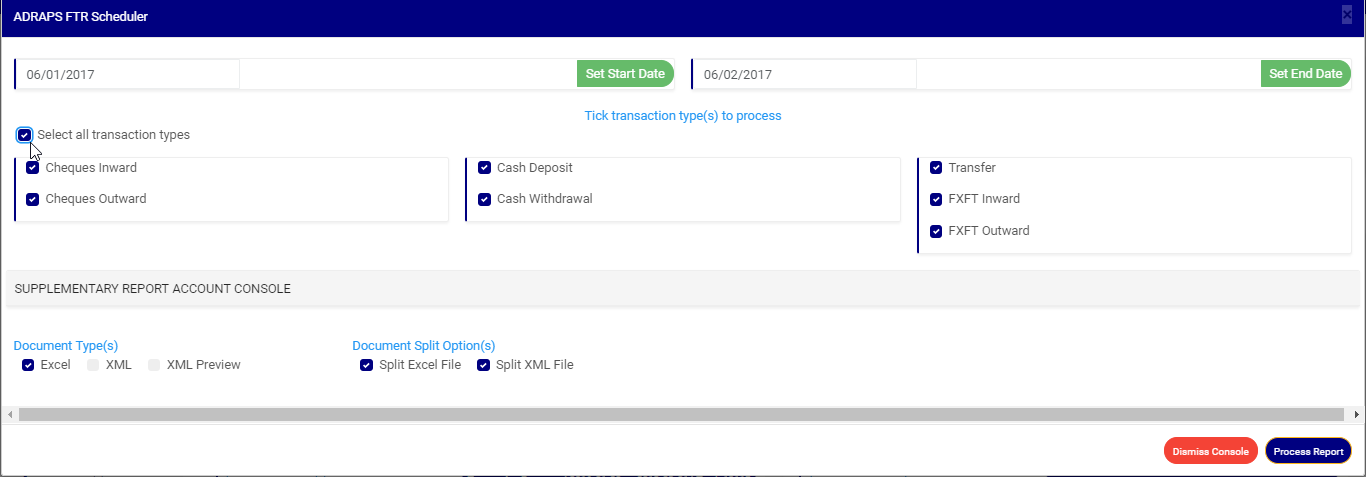
Click on ‘select all transactions’ to select all transactions with just a single click and the software will mark all the FTRs for you. Click on ‘Select all transaction types’ as in fig. 3.4g to mark all transactions for processing at once, instead of marking them one by one.
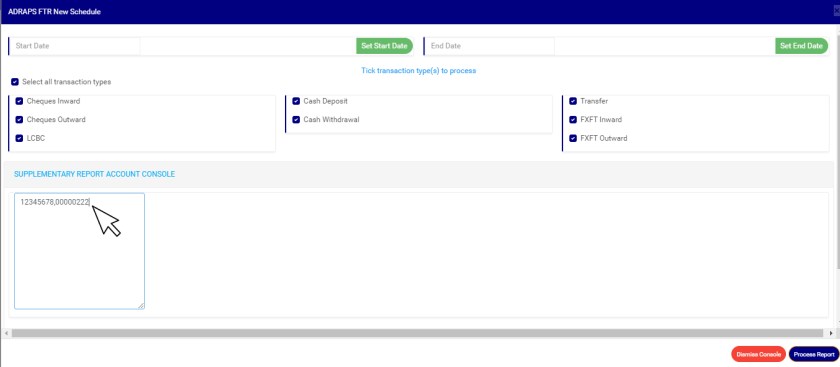
STEP 4: Click on ‘SUPPLEMENTARY REPORT ACCOUNT CONSOLE’ as shown below to download report pertaining to Specific account numbers only within the period selected.
- This displays a textbox where the account number(s) are to be inserted. Note that each account number is to be separated by a comma. See an example below
STEP 5: Select the document type you want your report to be in. The software has two options; Excel or XML. So, tick either of the two or select both options. See fig. 3.4h for an example.
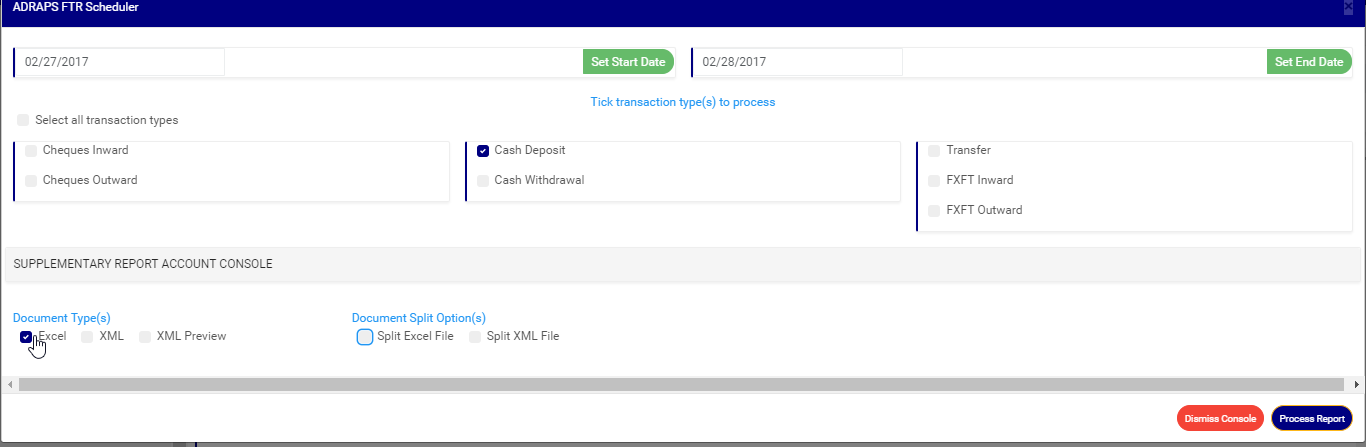
STEP 6: Tick the document split option(s). This step is optional. It all depends on if you want to combine all the selected FTRs that you want to process into one file or produce the reports of each FTR into separate files. By clicking on the document split options for either Excel file or XML, the software will generate report for the different transaction types separately. For instance, in the fig. 3.4i, ticking the split option will result in the software generating separate file for each ADRAPS FTR transaction type. Reports can be exported in Excel format or XML format.

STEP 7: Click on Process Report to generate files. The ‘Process Report’ button is the blue button at the bottom-right corner of the ADRAPS FTR Console. Check out fig. 3.4j below to see this button.
➔ Next to it is the Dismiss Console button for closing the console. When you dismiss the console, you can also go back to it by clicking on ‘Generate Report’ and you can continue with your scheduling.
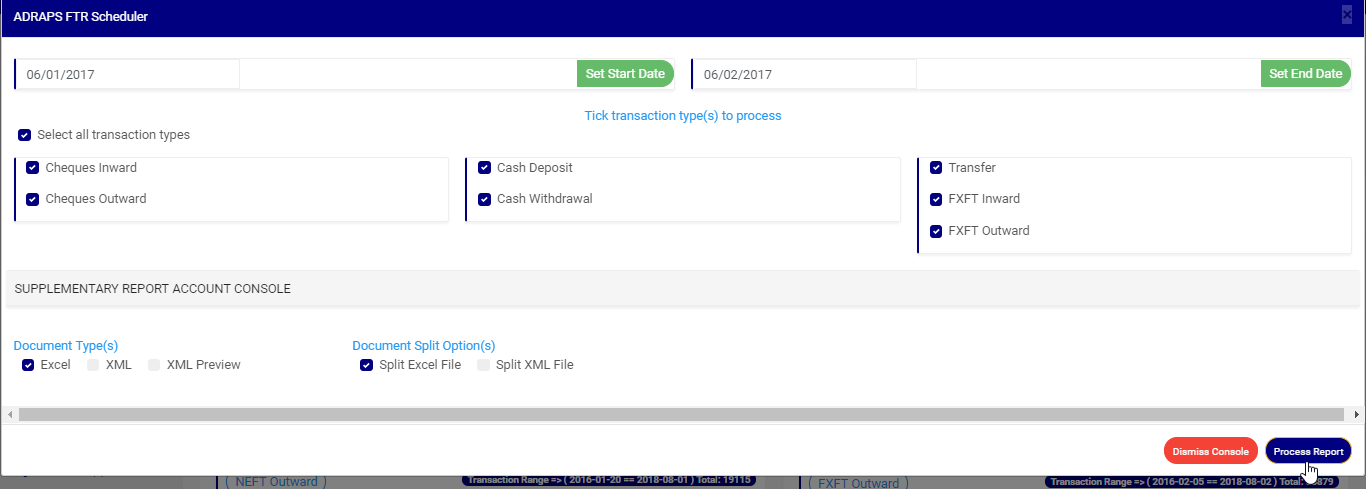
(fig. 3.4j)
➔ When you click on ‘Process Report’, a confirmation console will be displayed as in fig. 3.4k. The confirmation console presents two buttons; Confirm and Cancel.
➔ To make changes to your report settings on the ADRAPS FTR Console, click on cancel. The software takes you back.
➔ Click on Confirm to confirm your answer.
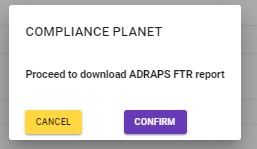
(fig. 3.4k)
➔ The signal console shows on going processes. This console will notify you of successful and unsuccessful processes. An example of a signal console is fig. 3.4l below.
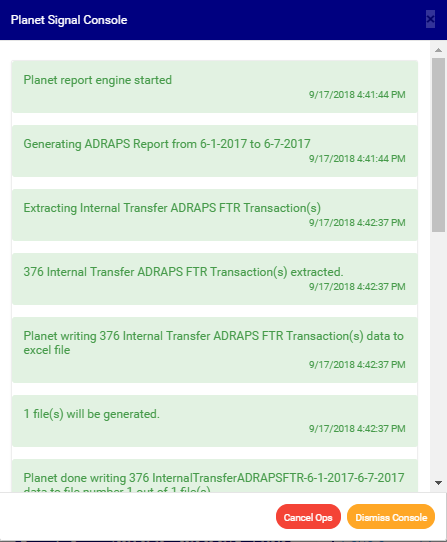
(fig. 3.4l)
➔You can terminate unfinished processes by clicking CANCEL OPS.
➔ To minimize signal console, click on DISMISS CONSOLE. This button is next to the CANCEL OPS. button.
➔ If you want to view processes going on after closing the signal, click on the ‘Console Ops.’ drop-down button. This button is one of the green buttons at the top of the page, irrespective of whatever page you are working on. A list will be displayed below the button with DISPLAY CONSOLE and CLEAR CONSOLE as in fig. 3.4m. So, click on display console to view the ongoing processes on a signal console like fig. 3.4m or click on clear console to delete the notifications in the signal console.
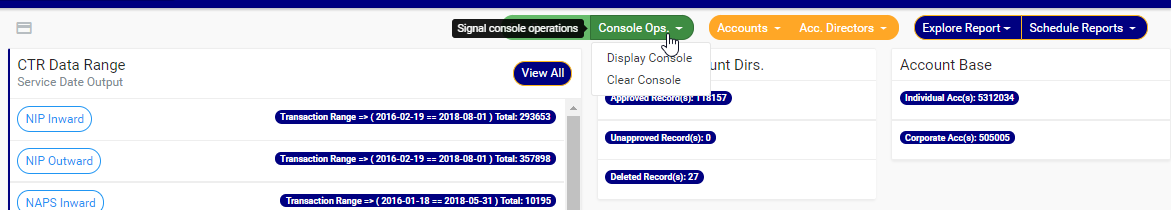
(fig. 3.4m)
For further enquiries :
Tel +234(0) 816 555 9818
Email solutions@efuelite.com
Web http://solutions.efuelite.com
