The Compliance Planet maintains a record of all PEP reports that have been manually scheduled. In this section, you will learn how to access your scheduled PEP report and explore additional features to enhance your experience.
NOTE: Only person(s) assigned the right to ‘view PEP Report’ can carry out these operations.
STEP 1: From the app dashboard, click on “REGULATORY REPORTS” as in Fig. 4.4a below.
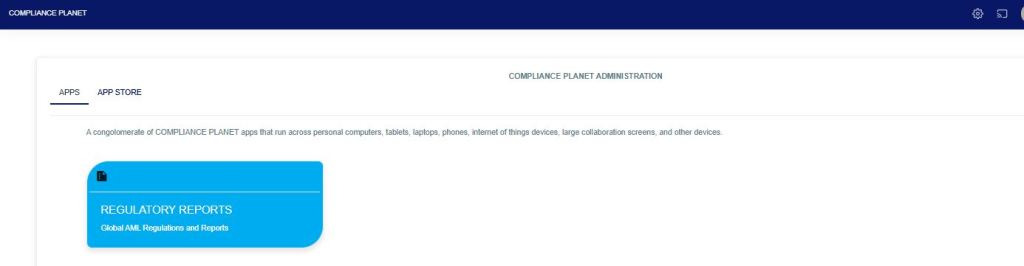
Fig 4.4a
STEP 2: Click ‘CBN ADRAPS PEP’ on the drop-down list and display the PEP page as in Fig. 4.4b below.
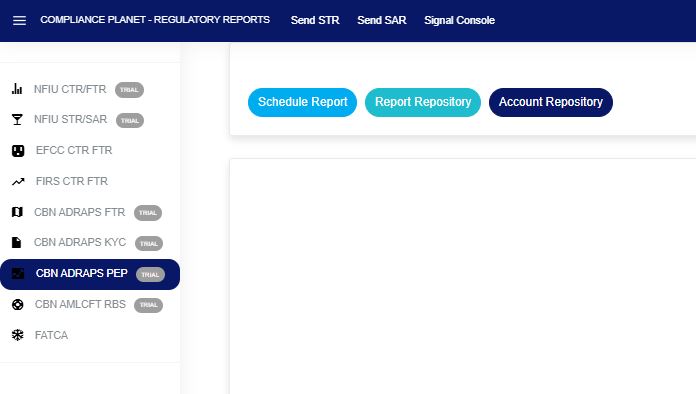
Fig 4.4b
STEP 3: From the menu, click “Report Repository” as in Fig. 4.4c below.
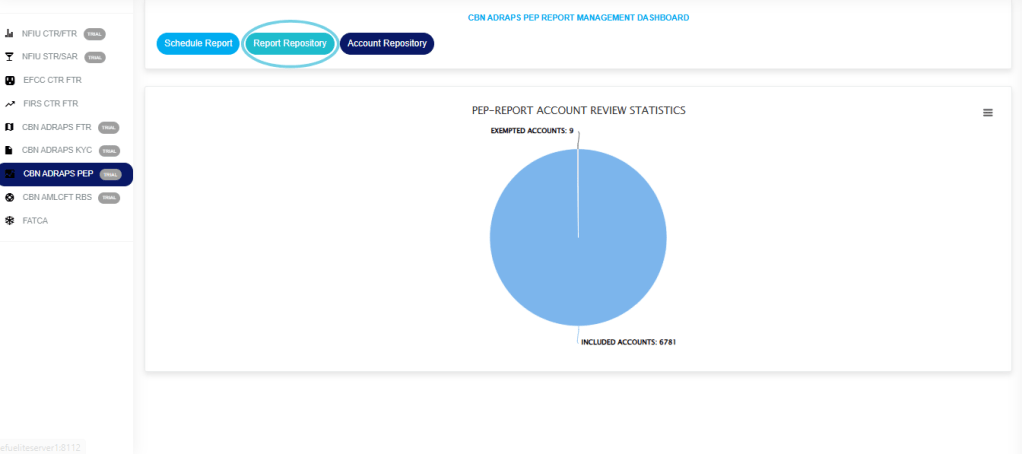
Fig 4.4c
- This will display a page as in Fig. 4.4c below.
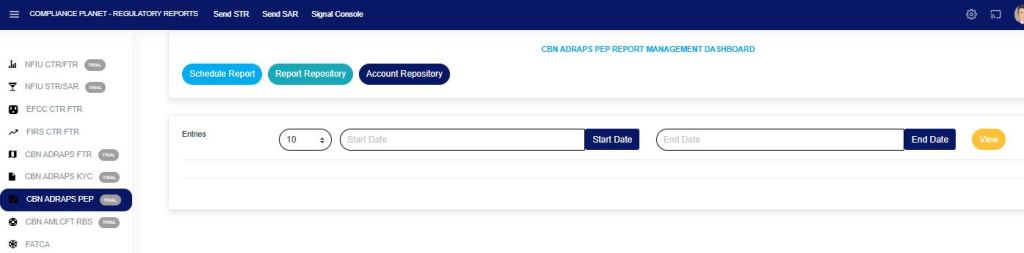
Fig 4.4c
STEP 4: Click on the “START DATE” button/box and the “END DATE” button/box to set the beginning and the end of the period in which the reports you want to see have been scheduled. See how to do this in Fig. 4.4d below. Fig. 4.4e shows a labeled calendar to guide you on how to use it effectively.
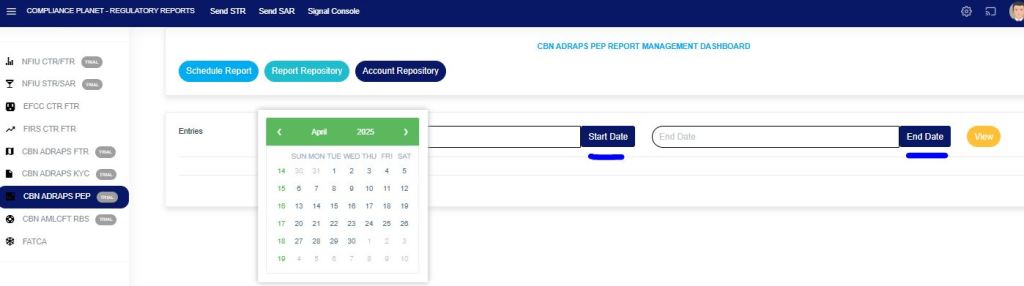
Fig 4.4d
- Take a look at the arrows labelled a to d in Fig. 4.4e to study the calendar.
- Click on the given year to change it to your year of choice.
- Click on the given month to change it to your month of choice.
- Then, click on the date of the month.
- You can also click on the angle brackets on the calendar [ ‘<’ or ‘>’ ] to go backward or forward.
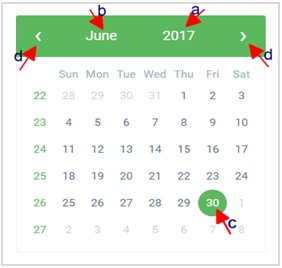
Fig 4.4e
- For instance, to see reports for January 2022, the start and end dates would be 2022-01-01 and 2022-01-31, respectively. See an example in Fig. 4.4f below.
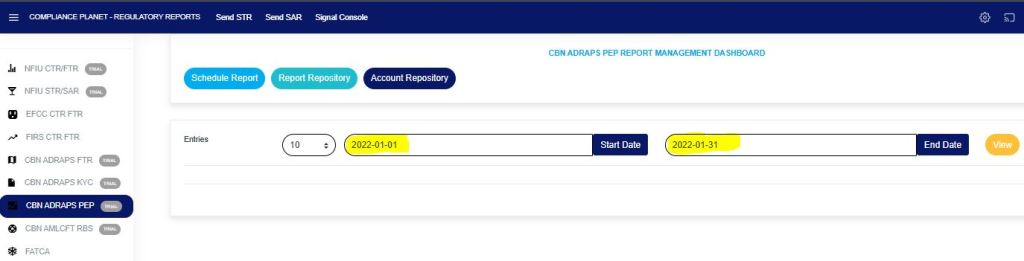
Fig 4.4f
- You can increase the number of reports you want to see per page by clicking on the “ENTRIES” box. Pick any number of entries per page of your choice. See Fig. 4.4g below for an example.
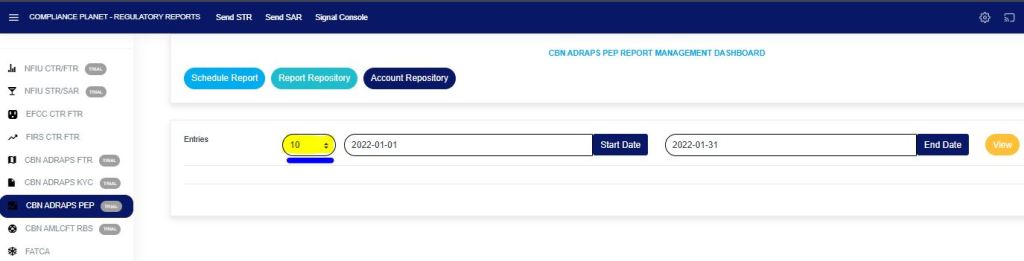
Fig 4.4g
STEP 5: Click on the “VIEW” button to see the reports. It is an orange button at the upper area of the page, next to the END DATE box. By doing this, the planet will initiate a search, and reports that were scheduled for the period you entered in the date boxes will appear, as shown in Fig. 4.4h. Click on the view button to see the results of the example in Fig. 4.4i.
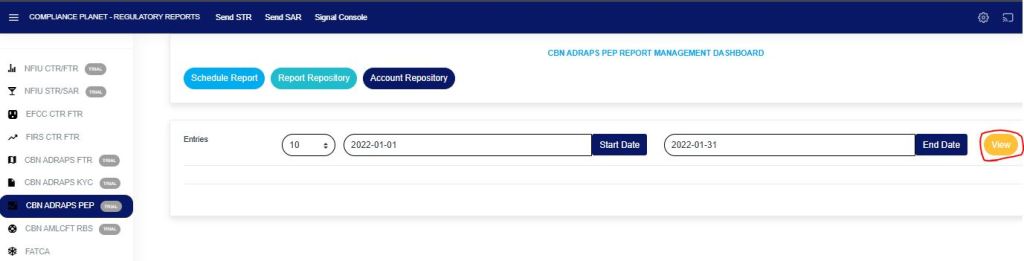
Fig 4.4h
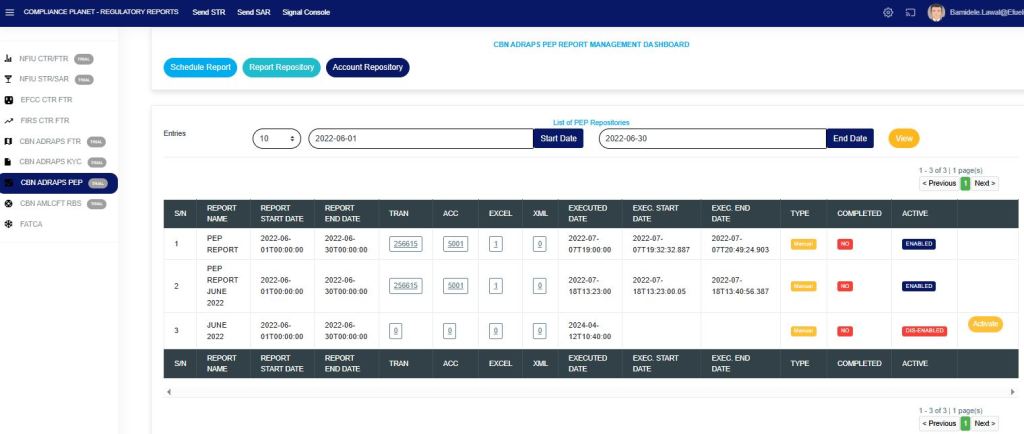
Fig 4.4i
- You can make changes to your date, but to effect the changes you have made on the page, click on VIEW.
For instance, when you change the date entries, click on View to see the reports for the new date range you have just set. - The results of the report(s) that fall within that date range will be displayed row by row.
- On every row, for each report, the software will give information about the Number of transactions contained in each report.
Number of accounts involved.
Number of Excel files and XML files the software has exported report information into.
Execution date and time.
Start date and end date.
Type of report.
Completed column showing a comment on whether the processing of the report has been completed or not. See Fig. 4.4i above. - TRAN
The numbers under the ‘Tran’ column (in Fig. 4.4i) represent the number of transactions carried out by the PEPs that are being reported in the respective reports.
Click on the “Number of “transactions” and a page displaying a list of transactions carried out by the PEPs in the particular report will be displayed. See Fig. 4.4j below for an example of a PEP repository transaction(s) page.
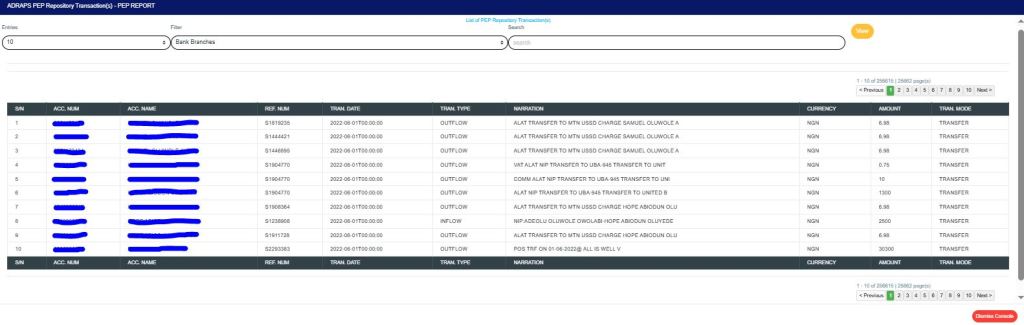
Fig 4.4j
PEP REPOSITORY TRANSACTION PAGE
The PEP Repository Transaction page has various features, and here are the following steps on how to use them:
- ENTRIES
Click on the “Entries” box to adjust the number of transactions you want to see per page. See Fig. 4.4k below for an example of how to do this. The software will automatically apply your changes.
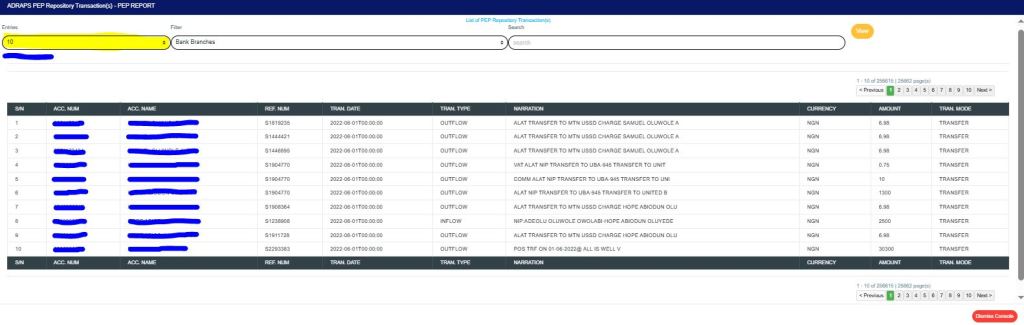
Fig 4.4k
- FILTER
Click on the “Filter” box to select a bank branch for which you want to see PEP transactions. See Fig. 4.4l below for an example of how to do this.

Fig 4.4l
- VIEW
After selecting the bank branch of your choice in the filter box as in Fig. 4.4l above, click on “VIEW” to see the transactions attached to the selected bank branch. See Fig. 4.4m for an example on how to do this.

Fig 4.4m
- SEARCH
To search for a particular transaction using an account number, account name, reference number, transaction type, narration, amount, or transaction mode. Click the “SEARCH” box and type in the search term as in the example in Fig. 4.4n below.
The software will search out the search term as soon as you type in a character in the search box.
You do not have to click on the VIEW button.
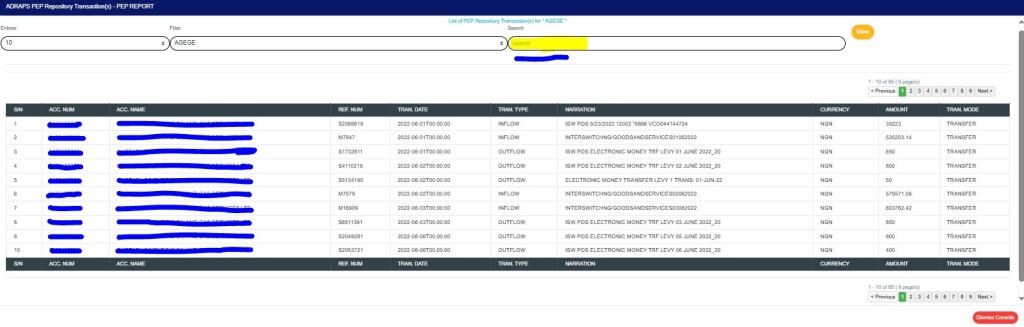
Fig 4.4n
- PREVIOUS AND NEXT
At the top-right and bottom-right corners, you see information about the number of pages. All the page numbers represent buttons for each page. By clicking on any page number, the software takes you to that particular page. Click on the “NEXT” button to take you to the next page.
Click on the “PREVIOUS” button to navigate to the previous page. - DISMISS
To close this page, click on the “DISMISS” button at the bottom-right corner of the page.
ACC
The numbers under the “ACC” column (in Fig. 4.4i) represent the number of PEP accounts being reported in each report.
Click on the “Number of accounts” option, and the software will display a page listing the PEP accounts and their respective details. See Fig. 4.4o below to see an example of the PEP repository account(s) page.
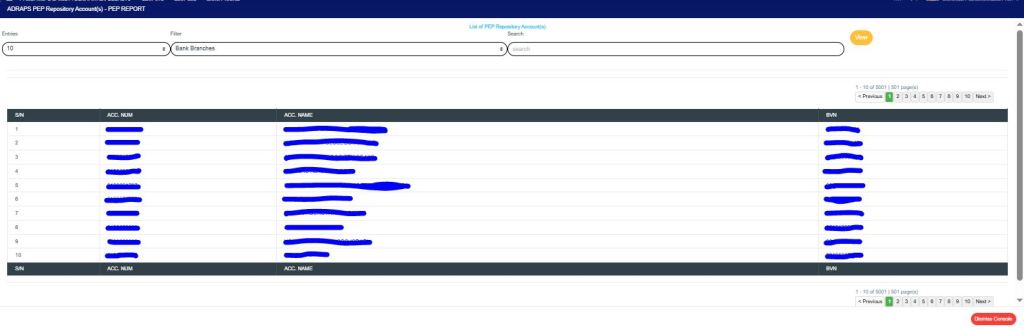
Fig 4.4o
PEP REPOSITORY ACCOUNT(S) PAGE
The PEP Repository Account(s) page has various features, and here are the following steps on how to use them:
- ENTRIES
Click on the “ENTRIES” box to adjust the number of accounts you want to see per page. - FILTER
Click on the “FILTER” box to select a bank branch for which you want to see PEP accounts. - VIEW
After selecting the bank branch of your choice, click on “VIEW” to see the accounts attached to the selected bank branch. See Fig. 4.4p below for an example of how to do this.

Fig 4.4p
- SEARCH
You can search for a particular account using the account number, account name, or BVN.
Click the “SEARCH” box and type in the search term as in the example in Fig. 4.4q below.
The software will automatically search for your search term as soon as you type in a character in the search box.
You do not have to click on the VIEW button.
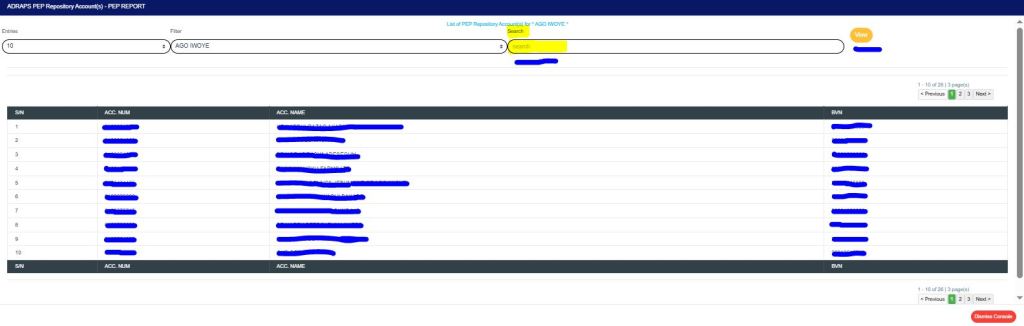
Fig 4.4q
- PREVIOUS AND NEXT
At the top-right and bottom-right corners, you see information about the number of pages. All the page numbers represent buttons for each page. By clicking on any page number, the software takes you to that particular page. Click on the “NEXT” button to take you to the next page.
Click on the “PREVIOUS” button to navigate to the previous page. - DISMISS
To close this page, click on the “DISMISS” button at the bottom-right corner of the page.
EXCEL
The numbers under the ‘Excel’ column (in Fig. 4.4i) also represent the number of Excel files that the software has written the report into.
Click on the “Number of Excel files”; a page will display as shown in Fig. 4.4r below.

Fig 4.4r
PEP REPOSITORY EXCEL FILE(s) PAGE
The PEP Repository Excel file(s) page gives information about the Excel file name(s), the number of times users have downloaded the file, and the download history.
Here are the steps on how to make use of the PEP Repository Excel file(s) page features:
- ENTRIES
Click on the “ENTRIES” box to adjust the number of Excel files you want to see per page. See Fig. 4.4s below for an example of how to do this. The software will automatically apply your changes whenever you make this change.
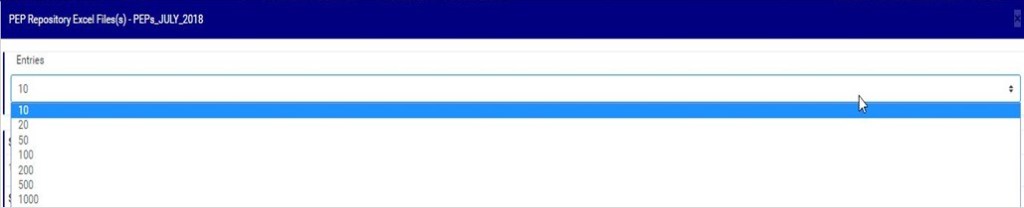
Fig 4.4s
- FILE NAME
Click on the “FILE NAME” to download the Excel file to your computer. The file name is underlined, and the download happens immediately! The number of downloads changes immediately when you click on the file name.
Compliance Planet is fast and easy!
See Fig. 4.4t below for an example of how to download the PEP Excel file.
NOTE: Only person(s) assigned the right to ‘view PEP Report’ and ‘download PEP Report’ can carry out these operations.
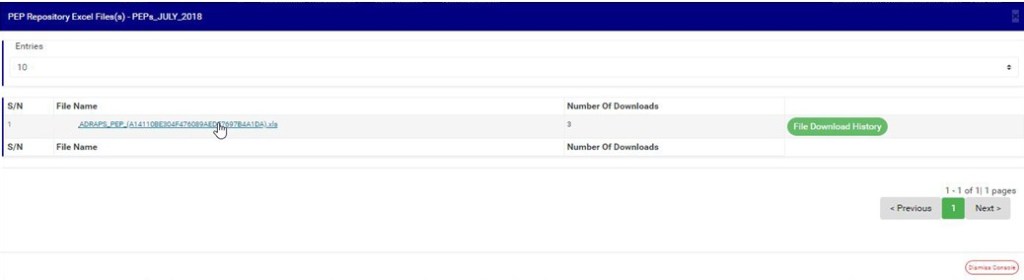
Fig 4.4t
- FILE DOWNLOAD HISTORY
To see who downloaded the file and the time of download, click on the ‘File Download History’ button. A console will be displayed as in Fig. 4.4u below. Close the console using the “DISMISS” button at the bottom-right corner of the console.
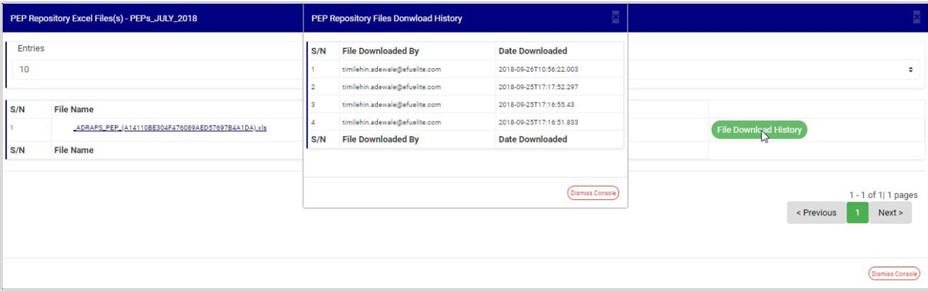
Fig 4.4u
- PREVIOUS AND NEXT
At the top-right and bottom-right corners, you see information about the number of pages. All the page numbers represent buttons for each page. By clicking on any page number, the software takes you to that particular page. Click on the “NEXT” button to take you to the next page.
Click on the “PREVIOUS” button to navigate to the previous page. - DISMISS
To close this page, click on the “DISMISS” button at the bottom-right corner of the page.
XML
The numbers under the ‘XML’ column (in Fig. 4.4i) also represent the number of XML files into which the software has written the respective report. Clicking on the number of XML files displays a page as in Fig. 4.4v below.
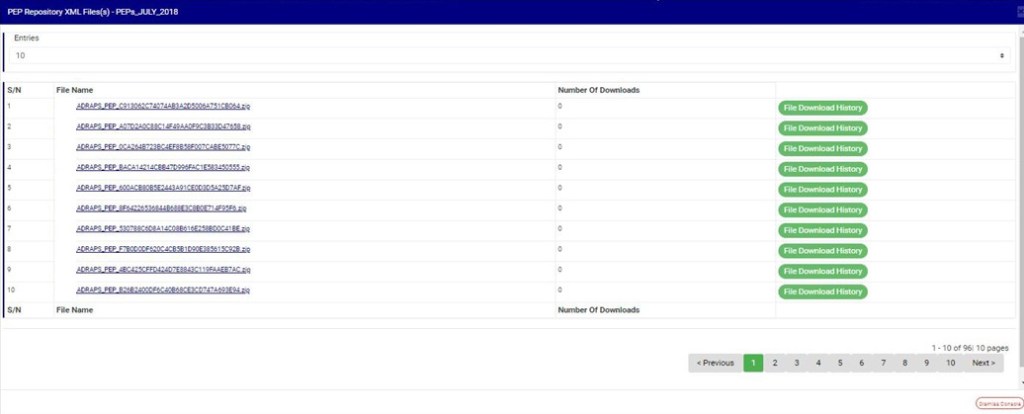
Fig 4.4v
PEP REPOSITORY XML FILE(S) PAGE
The PEP Repository XML file(s) page also gives information about the XML file name(s), the number of times users have downloaded the file(s), and the download history. There are 500 PEP transactions per XML file. The features on the PEP Repository XML file(s) page function similarly to those on the PEP Repository Excel file(s) page.
Here are the steps on how to make use of the PEP Repository Excel file(s) page features:
- ENTRIES
Click on the “ENTRIES” box to adjust the number of XML files you want to see per page. See Fig. 4.4w below for an example of how to do this. The software will automatically apply your changes whenever you do this.
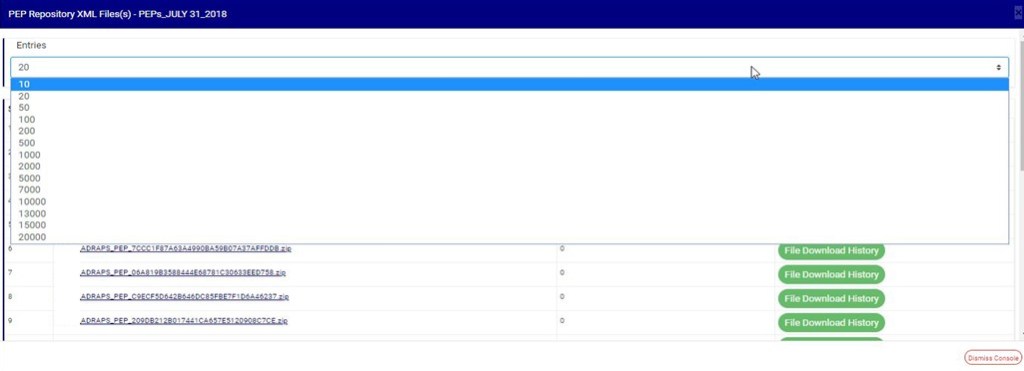
Fig 4.4w
- FILE NAME
Click on the “FILE NAME” to download the XML file to your computer. The number of downloads changes immediately when you click on the file name. The file name is underlined, and the download is immediately also!
See Fig. 4.4x below for an example of how to download a PEP XML file.
NOTE: Only person(s) assigned the right to ‘view PEP Report’ and ‘download PEP Report’ can carry out these operations.
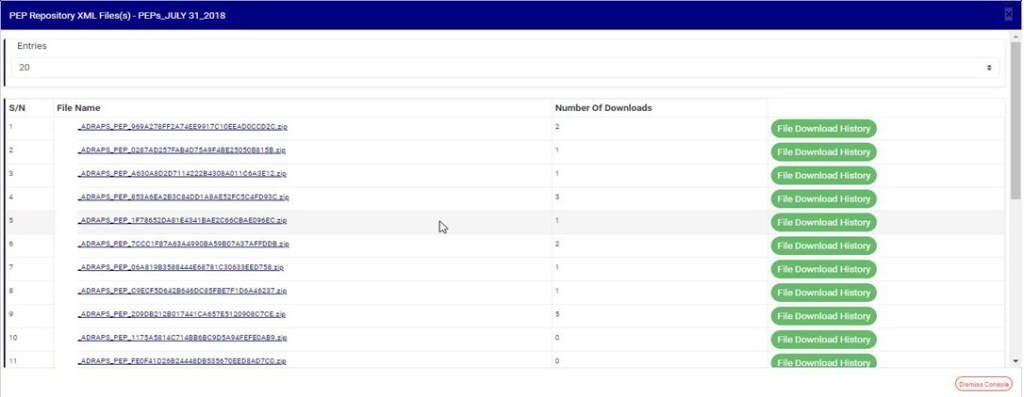
Fig 4.4x
- FILE DOWNLOAD HISTORY
To see who downloaded the file and the time of download, click on the ‘File Download History’ button. A console will be displayed as shown in Fig. 4 .4 below. Close the console using the “DISMISS” button at the bottom-right corner of the console.
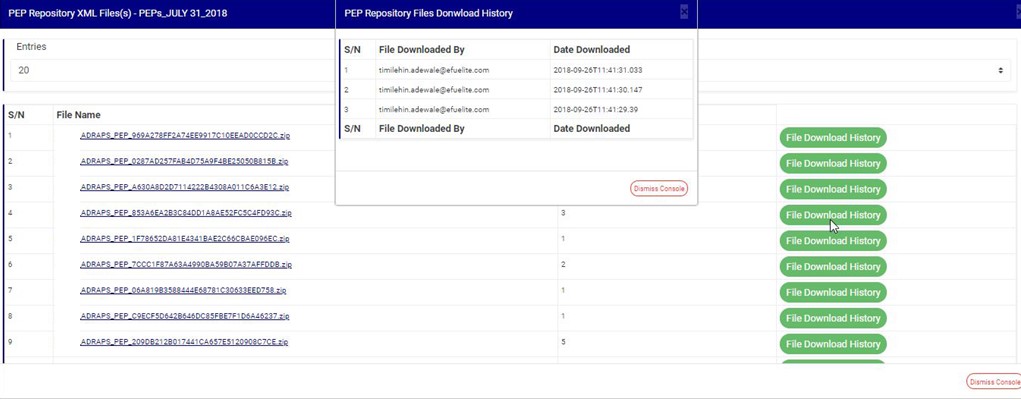
Fig 4.4y
- PREVIOUS AND NEXT
At the top-right and bottom-right corners, you see information about the number of pages. All the page numbers represent buttons for each page. By clicking on any page number, the software takes you to that particular page. Click on the “NEXT” button to take you to the next page.
Click on the “PREVIOUS” button to navigate to the previous page. - DISMISS
To close this page, click on the “DISMISS” button at the bottom-right corner of the page. - Back to fig. 4.4i – PEP Repository list page: At the end of each report row, the software indicates whether the report processing is enabled or disabled under the ‘ACTIVE’ column.
- For reports that have been completed, their status will read ‘ENABLED’. See fig. 4.4i for an instance.
- For reports that have not been completed, and whose status reads ‘DIS-ENABLED’, there will be an extra button next to their ACTIVE status. This button is used to “ACTIVATE” or “DEACTIVATE” the processing of the report.
See Fig. 4.4z below for an example.
The button turns red when the report is enabled, and it can be used to DEACTIVATE the report. It is yellow when the report is disabled, and it can be used to ACTIVATE the report for processing.
NOTE: Only person(s) assigned the right to ‘view PEP Report’ and ‘Edit PEP Report’ can carry out these operations.
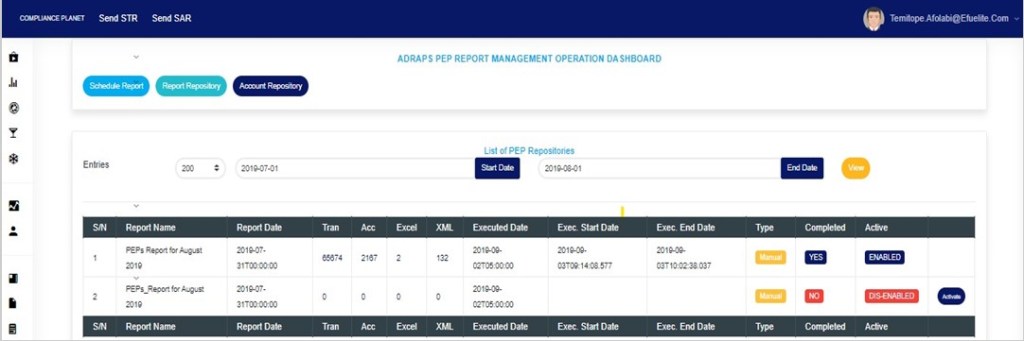
Fig 4.4z
- As in Fig. 4.4z above, the second report has not been completed. Click on “Activate” to enable processing of the report or “Deactivate” to disable the report.
- Click on “ACTIVATE” to turns the status bar of the report to green with an ‘ENABLED’ inscription, while clicking on “DEACTIVATE” will turn the status bar back to red with an ‘DIS-ENABLED’ inscription. See Fig. 4.4aa and Fig. 4.4ab to see the result of activating the report for an example, and see Fig. 4.4ac and Fig. 4.4ad to see the result of deactivating the report for another example.
Activating a report
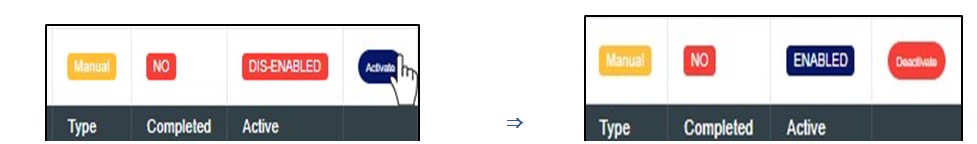
Fig 4.4aa Fig 4.4ab
Deactivating a report
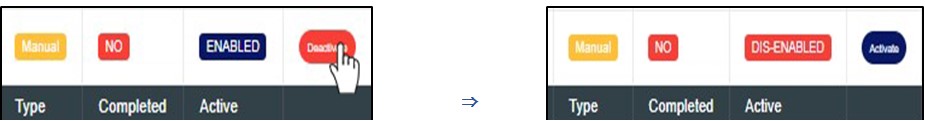
Fig 4.4ac Fig 4.4ad
- At the top and end of the page, the software gives information about the number of pages of your result, with the page numbers written out. All the page numbers represent buttons for each page. By clicking on any page number, the software takes you to that particular page. There is the “NEXT” button to take you to the next page when you click on it, and there is a “PREVIOUS” button to take you to the page before the one you are viewing at that moment. See these features in Fig. 4.4ae below.
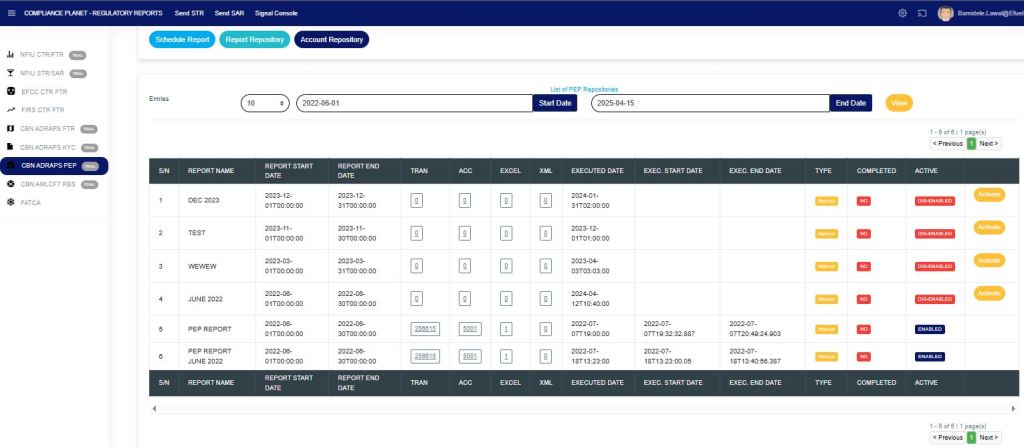
Fig 4.4ae
For further enquiries :
Tel +234(0) 816 555 9818
Email solutions@efuelite.com
Web http://solutions.efuelite.com
