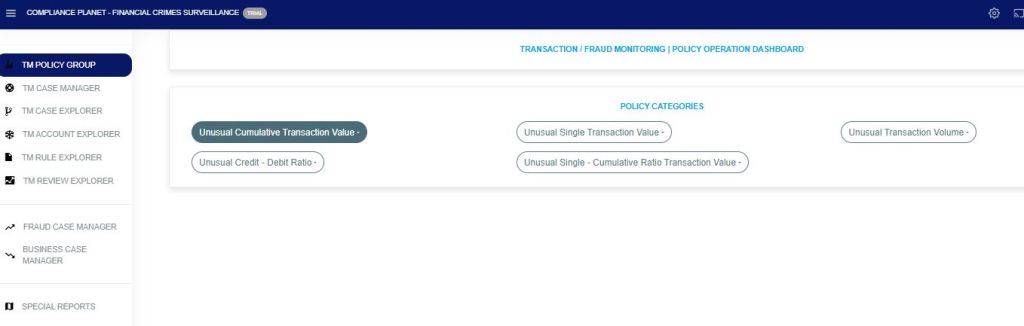
The Compliance Planet Anti Money Laundering/Core Bank Finance Software has several policy groups under Transaction/Fraud Monitoring to handle a wide range of monitoring scenarios.
Below are the different policy categories and their explanation.
UNUSUAL SINGLE TRANSACTION VALUE This policy category allows the creation of transaction/fraud monitoring rules to monitor single transaction inflow and/or outflow over a specified period. This policy category allows setting dynamic periods from account inception, account age (moving period of account birth date), etc. It will provide instant signals when customer transaction thresholds change.
UNUSUAL TRANSACTION VOLUME This policy category facilitates the creation of transaction/fraud monitoring rules to track inflows and outflows that surpass a predetermined threshold based on the total volume of transaction activity over a set timeframe. It provides real-time alerts for any potentially suspicious customer transaction counts or volumes.
UNUSUAL CUMULATIVE TRANSACTION VALUE This policy category enables the formulation of transaction/fraud monitoring rules to track inflows and outflows that exceed a defined threshold based on the total accumulated transaction value over a designated period. The policy generates immediate alerts when there is a notable change in the customer’s transaction threshold behavior.
UNUSUAL CREDIT/DEBIT TRANSACTION RATIO This policy category enables the creation of transaction/fraud monitoring rules to track inflows and outflows that exceed a designated credit/debit ratio above the total cumulative transaction, both inflows and outflows, over a specific time frame. It also allows for configuring adaptable periods, from the account’s creation to its current age, based on the account’s start date. The system provides immediate notifications when there are alterations in the customer’s transaction behavior.
UNUSUAL SINGLE CUMULATIVE RATIO TRANSACTION VALUE This policy category allows the creation of transaction/fraud monitoring rules to track inflows and outflows that exceed a defined percentage above the total cumulative transaction values, either inflow or outflow, accumulated over a specific past timeframe. It introduces the ability to set flexible monitoring periods, from the account’s inception, its current age, and other customizable intervals. It provides immediate alerts for unusual or potentially fraudulent customer transaction patterns.
Note: This operation requires the Administrator’s or Auditor’s permission.
The Global screening helps to scan an institution based on certain parameters, and if a match is found, it further displays the Scan Results(customers’ account(s)) and their score prediction assigned by the system.
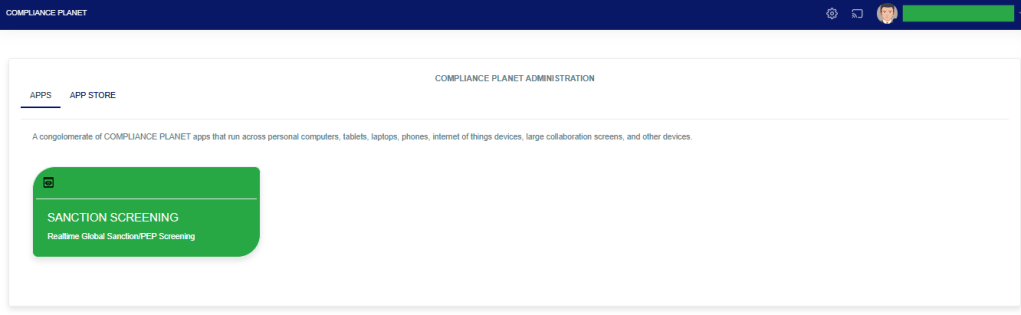
STEP 1: From the app dashboard, click on “SANCTIONSCREENING” as seen below.
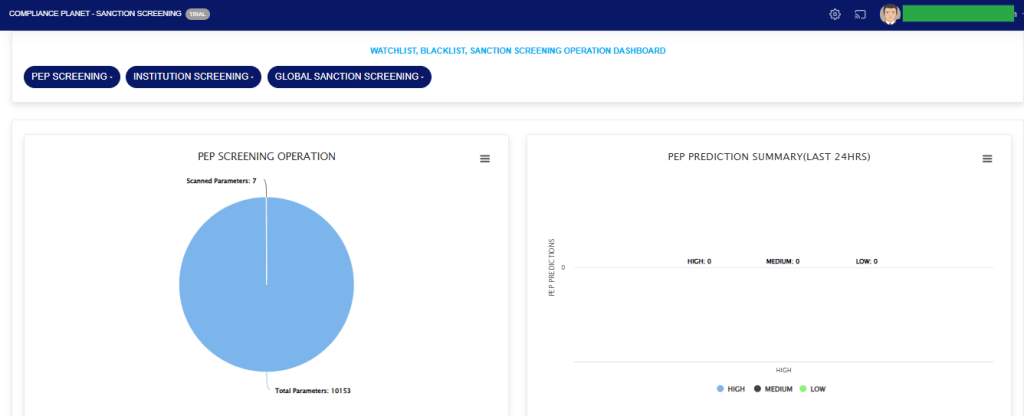
The above action will display a page as seen in the image below.
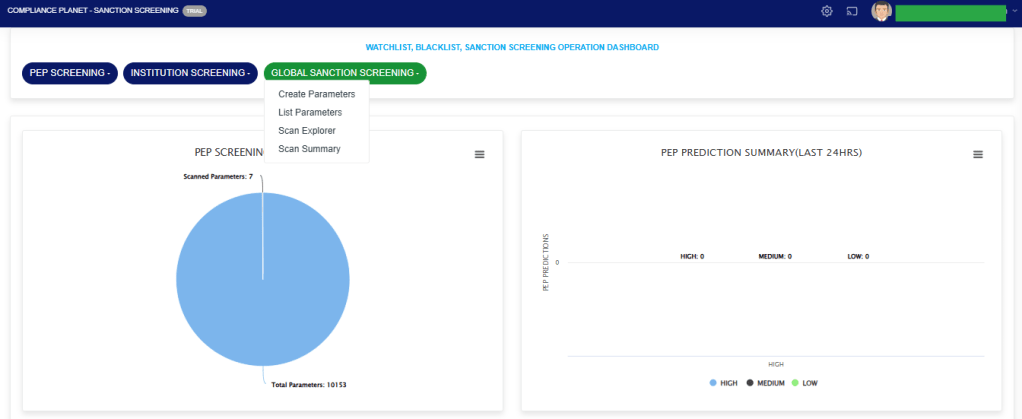
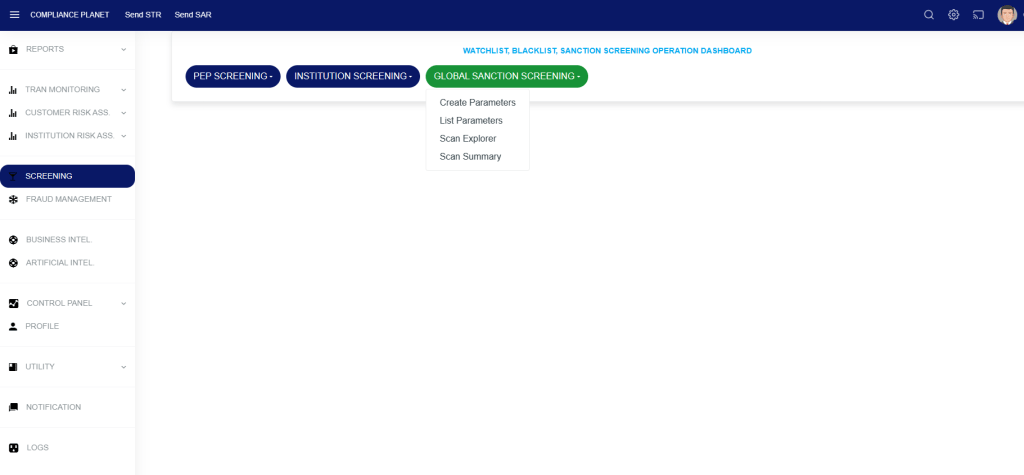
STEP 2: From the top menu, click “Global Sanction Screening”, this action will display a dropdown menu as seen in the image below. From the dropdown menu, click “Create Parameters”.
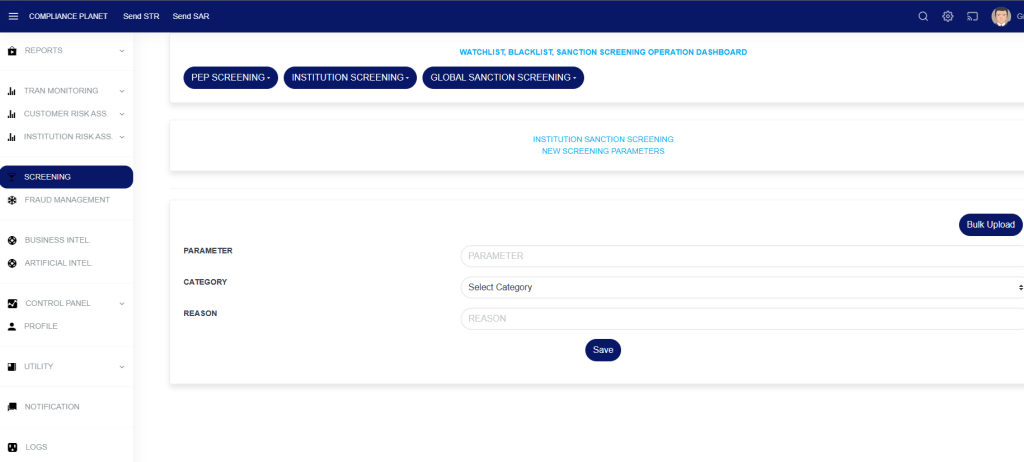
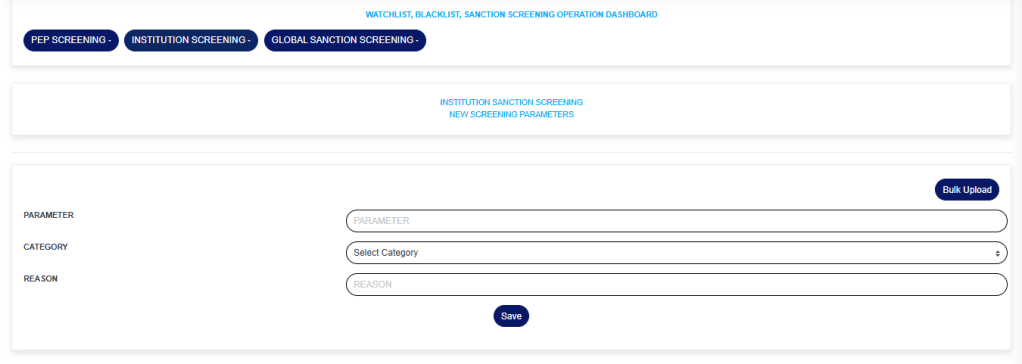
STEP 3: On the NEW SCREENING PARAMETERS page, fill in the fields.
PARAMETER: The parameter you want to scan
CATEGORY: The category of the parameter, this is a dropdown to select from.
REASON: The reason for scanning the parameter.
You can also bulk upload parameters already prepared in excel by clicking on the “Bulk Upload” button.
Click on the “Save” button to save the parameter.
Note: The category selected determines the parameter entered. e.g if the category selected is “NAME”, then the parameter should be a name. If the category selected is “EMAIL”, then the parameter should be an email address.
How to list the Global Screening Parameters
STEP 1: Click on “List Parameters” to see the list of parameters entered into the software.
STEP 2: The “GLOBAL SAANCTION SCREENING PARAMETERS” page shows the list of parameters that have been entered into the software and their scan status.
How to view the Global Screening scan explorer
Step 1: Click on the “Global Sanction Screening” dropdown button and select the “Scan Explorer” option.
The above action will display a page as seen in the image below.
The Scan Explorer provides details of scan results across the entered date ranges. These results can be filtered down to only results that are meaningful to you by applying various scan filters.
The function of the scan filters is explained below;
Start Date and End Date: These fields allow you to filter the list of scan results to a specific date range. The date range refers to the dates the parameters were scanned. This filter is mandatory.
Category: To view scan results having the same Category, select the desired Category from the Category dropdown and click on the View button.
Reasons: To view scan results having the same scan reason, select the desired Reason from the Reasons dropdown and click on the View button.
Entries: The number of scan results to see on the page.
Search: To search for the parameter(s).
L. Score and H. Score: The low score and high score work together to filter the results based on score prediction. The L. Score entered must be less than the H. Score. After entering your desired score prediction range, click on the View button to see the result.
Export To Excel: To export the list of scan results to Excel, click on the ‘Action‘ dropdown button and select “Export To Excel”
The data representation of the columns is explained below;
Account Number: The account number that the scan parameter matched.
Account Name: The account name that the scan parameter matched.
Date Opened: The date the matched account was opened.
Date Closed: The date the matched account was closed(This field is empty if the account is still open).
Account Status: The status of the matched account.
Scan Parameter: The actual scan parameter entered into the system
Scan Category: The category the scan parameter falls under. e.g Name, BVN, Email, etc…
Scan Prediction: This is the system prediction score for each parameter.
Scan Reason: The reason entered alongside the scan parameter.
Scan Date: The date the parameter was scanned.
How to view the Global Screening scan summary
Step 1: Click on the Global Screening dropdown button and select the “Scan Summary” option.
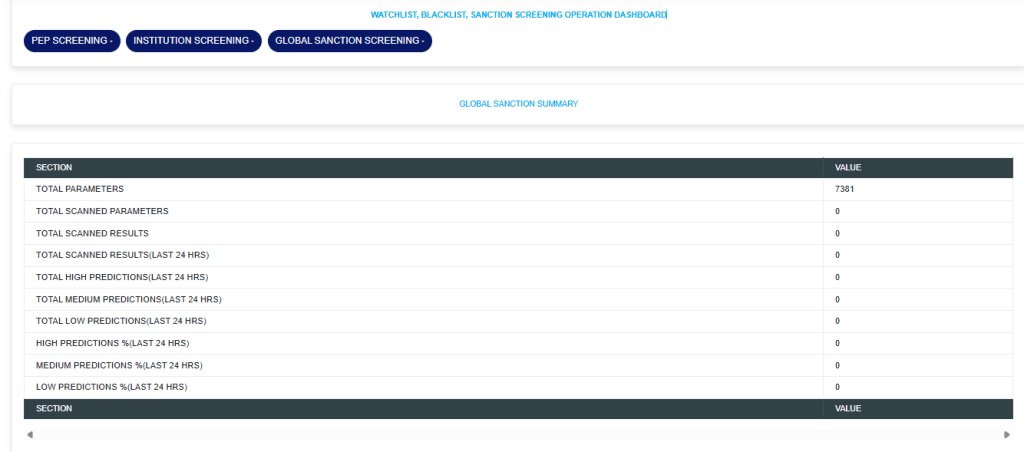
The above action will display a page as seen in the image below.
TOTAL PARAMETERS: This Section Value quickly informs the reviewer of the number of parameters uploaded into the system for scanning/screening purposes.
Parameters could be BVN, NAMES, ID Numbers, PHONE NUMBERS, or EMAILS.
TOTAL SCANNED PARAMETERS: This Section Value informs the reviewer how many parameters have been scanned thus far. This number would increase daily.
TOTAL SCANNED RESULTS: This Section Value informs the reviewer how many results are present from all parameters that have been scanned.
TOTAL SCANNED RESULTS(LAST 24 HRS): This Section Value informs the reviewer of the total number of new results from the scan conducted in the last 24 hours.
This aids the reviewer who may be reviewing on a daily basis, focusing on the newer scans and helping to attain a thorough review process. There are explorers where these scan results can be targeted by the date the scan results were entered by the software.
TOTAL HIGH PREDICTIONS(LAST 24 HRS): This Section Value plays a very important role as the software uses artificial intelligence and Machine Learning to learn the data from Scan results and give scores on how sure it is about the matches. The lowest score is 1 and the highest is 100.
100 means that the software is extremely confident that the scan result (a customer’s account) is an exact match to the scanned parameter.
This enables the reviewer to focus more closely on high matches and easily sort them out, thereby avoiding time wasted on false positives.
The software categorizes HIGH PREDICTIONS as scan results that score 80 and above. Furthermore, providing high predictions for the last 24 hours informs the reviewer how many records should be prioritized out of the total scanned results from the last 24 hours.
This further makes the review process faster. Predictions in this category are colored red for easy identification.
TOTAL MEDIUM PREDICTIONS(LAST 24 HRS): The software categorizes MEDIUM PREDICTIONS as scan results that score between 50 and 79. Predictions in this category are colored yellow for easy identification.
TOTAL LOW PREDICTIONS(LAST 24 HRS): The software categorizes LOW PREDICTIONS as scan results that score between 1 and 49. Predictions in this category are colored blue for easy identification.
HIGH PREDICTIONS%(LAST 24 HRS): This tells the percentage of high predictions in the scan results from scans conducted in the last 24 hours.
MEDIUM PREDICTIONS%(LAST 24 HRS): This tells the percentage of medium predictions in the scan results from scans conducted in the last 24 hours.
LOW PREDICTIONS%(LAST 24 HRS): This tells the percentage of low predictions in the scan results from scans conducted in the last 24 hours. The software gives a special prediction score of 81 to scan parameters it detects as Names of individuals that match the Signatory/Director of corporate accounts. With the software’s artificial intelligence and machine learning capabilities to scan and predict match accuracy probabilities, reviewing these scan results is made easier than expected.
The bulk upload helps in uploading more than one scan parameter into the system for the automatic scan.
Note: This operation requires the Administrator or Auditor’s permission.
How to Prepare the Scan Parameters in an Excel File
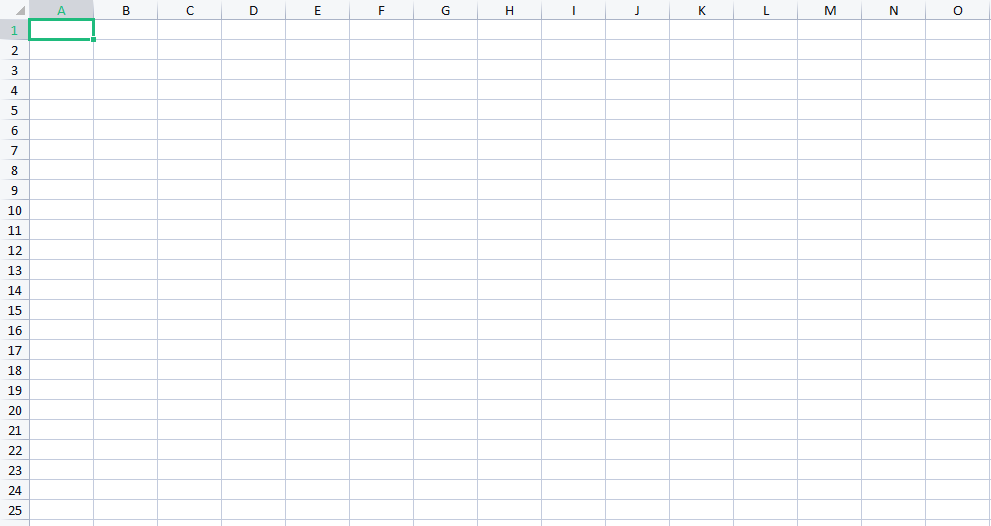
STEP 1: Open an excel sheet as seen in the image below. This must be the first sheet(Sheet1) in the excel workbook.
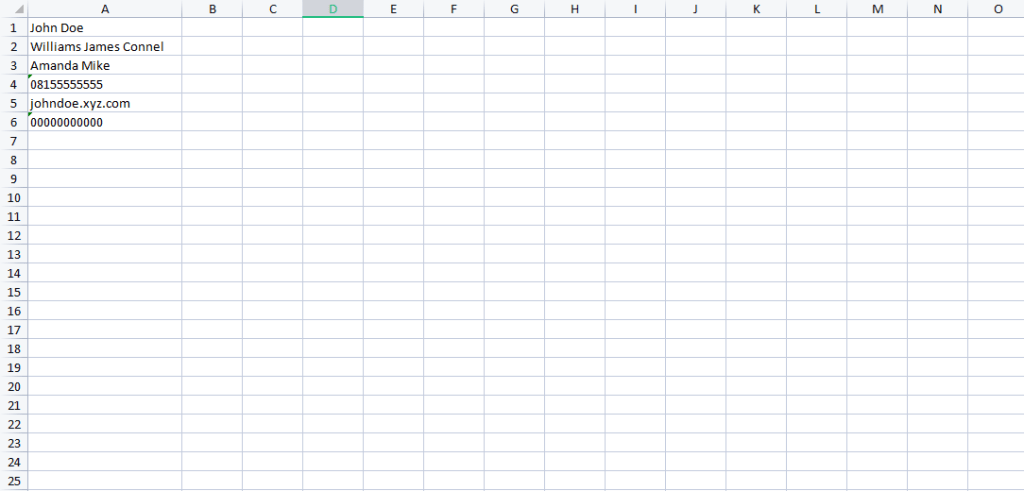
STEP 2: Fill in the scan parameters in the first column (column A) as seen in the image below.
The excel sheet should not have column names(Start inputting the scan parameters from row 1).
These scan parameters can be either a name, phone number, email address, ID Number, or BVN.
Note: The first, last and middle name must be in the same column with a space in between them (Column A).
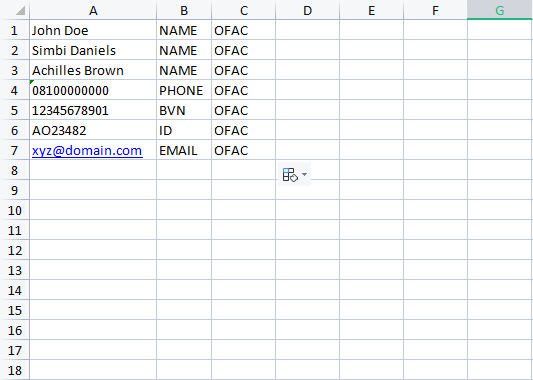
STEP 3: Fill in the scan parameter category in the second column (column B) as seen in the image below.
The software accepts four different parameter categories(Name, Email address, Phone Number, ID Number, and BVN).
1. When a scan parameter is a name, the category should be NAME
2. When a scan parameter is a phone number, the category should be PHONE
3. When a scan parameter is an email address, the category should be EMAIL
4. When a scan parameter is a BVN, the category should be BVN
5. When a scan parameter is an ID Number, the category should be ID
STEP 4: Fill in a reason in the third column (column C) as seen in the screenshot below.
Save the excel file and proceed to the Compliance Planet AML software.
How to Upload the scan parameters in the Compliance Planet Software
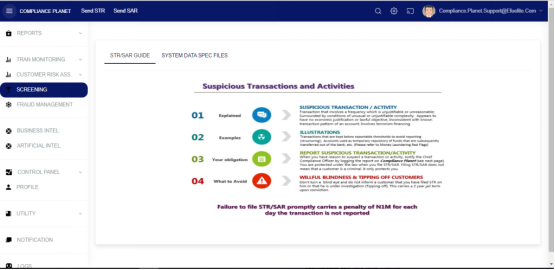
STEP 5: From the left-hand side menu, click “SCREENING” as seen below.
STEP 6: From the top menu, click “Global Sanction Screening”, this action will display a dropdown menu as seen in the image below. From the dropdown menu, click “Create Parameters”.
STEP 7: On the NEW SCREENING PARAMETERS page, click on the “Bulk Upload” button to select the excel file which you have earlier filled with the scan parameters.
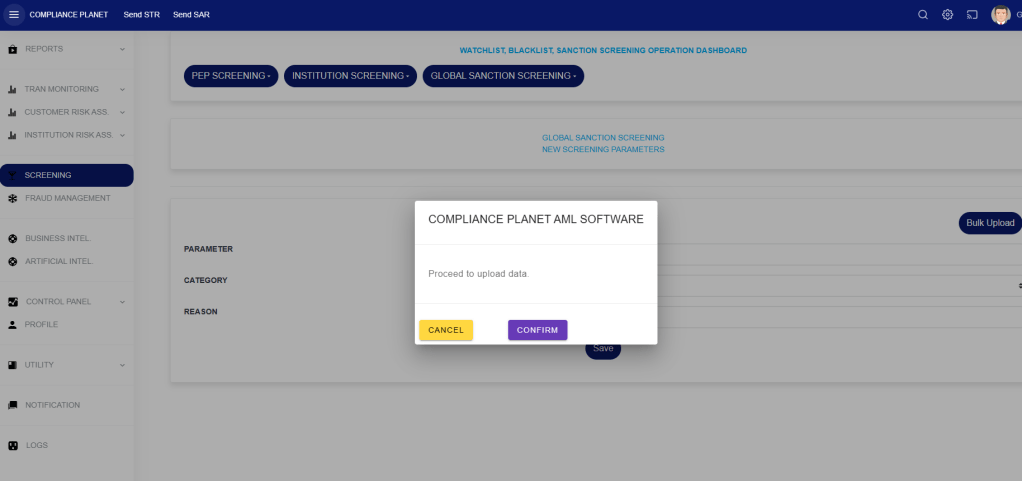
STEP 8: Click on the Save button.
STEP 9: Click on the CONFIRM button to begin the upload process.
The bulk upload helps in uploading more than one scan parameter into the system for the automatic scan.
Note: This operation requires the Administrator or Auditor’s permission.
How to Prepare the Scan Parameters in an Excel File
STEP 1: Open an excel sheet as seen in the image below. This must be the first sheet(Sheet1) in the excel workbook.
STEP 2: Fill in the scan parameters in the first column (column A) as seen in the image below.
The excel sheet should not have column names(Start inputting the scan parameters from row 1).
These scan parameters can be either a name, phone number, email address, ID Number, or BVN.
Note: The first, last and middle name must be in the same column with a space in between them (Column A).
STEP 3: Fill in the scan parameter category in the second column (column B) as seen in the image below.
The software accepts four different parameter categories(Name, Email address, Phone Number, ID Number, and BVN).
1. When a scan parameter is a name, the category should be NAME
2. When a scan parameter is a phone number, the category should be PHONE
3. When a scan parameter is an email address, the category should be EMAIL
4. When a scan parameter is a BVN, the category should be BVN
5. When a scan parameter is an ID Number, the category should be ID
STEP 4: Fill in a reason in the third column (column C) as seen in the screenshot below.
Save the excel file and proceed to the Compliance Planet AML software.
How to Upload the scan parameters in the Compliance Planet Software
STEP 5: From the left-hand side menu, click “SCREENING” as seen below.
STEP 6: From the top menu, click “INSTITUTION Screening”, this action will display a dropdown menu as seen in the image below. From the dropdown menu, click “Create Parameters”.
STEP 7: On the NEW SCREENING PARAMETERS page, click on the “Bulk Upload” button to select the excel file which you have earlier filled with the scan parameters.
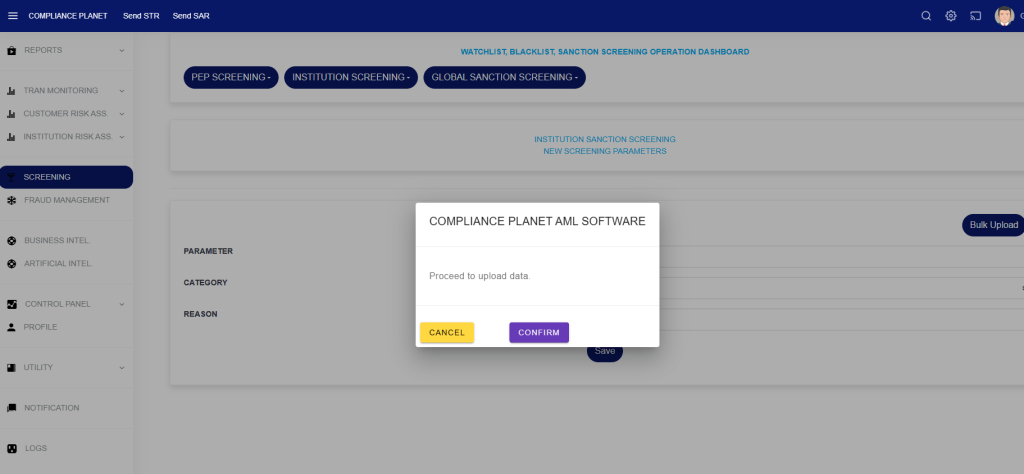
STEP 8: Click on the Save button.
STEP 9: Click on the CONFIRM button to begin the upload process.
Note: This operation requires the Administrator’s or Auditor’s permission.
The Institution screening helps to scan an institution based on certain parameters. If a match is found, it further displays the Scan Results (customers’ account(s)) and the system’s assigned score prediction.
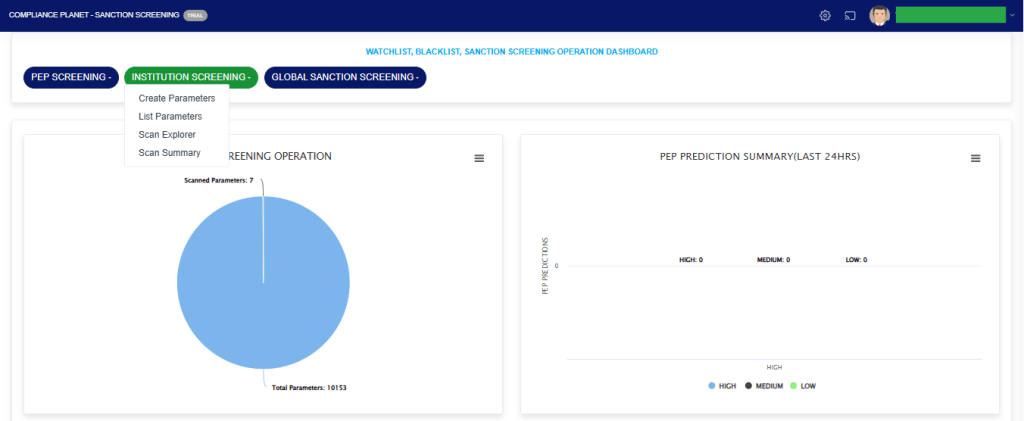
STEP 1: From the app dashboard, click “SANCTION SCREENING” as seen below.
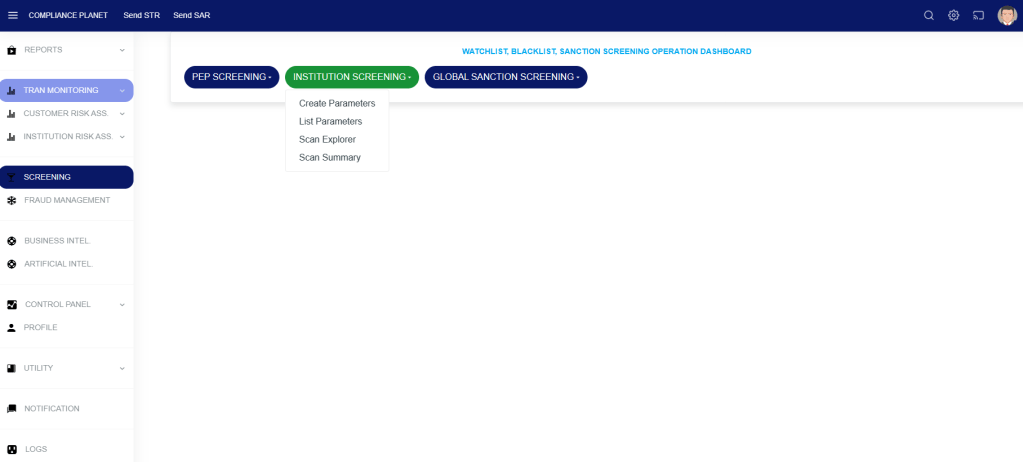
STEP 2: From the top menu, click “Institution Screening.” This action will display a dropdown menu as seen in the image below. From the dropdown menu, click “Create Parameters”.
STEP 3: Fill in the fields on the “NEW SCREENING PARAMETERS” page
Click on the “Save” button to save the parameter.
Note: The selected category determines the entered parameter. e.g., if the selected category is “NAME”, then the parameter should be a name. If the selected category is “EMAIL”, the parameter should be an email address.
How to list the Institution Screening Parameters
STEP 1: Click on “List Parameters” to see the list of parameters entered into the software.
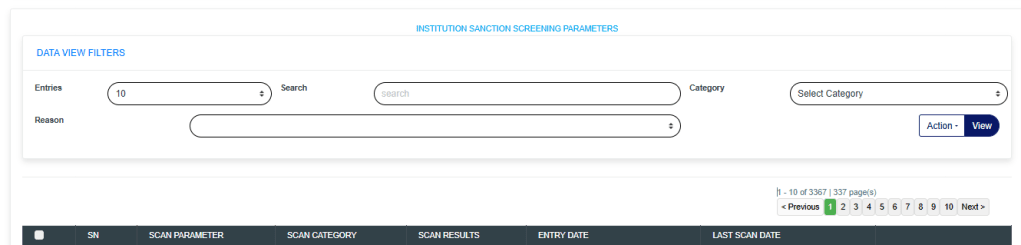
STEP 2: The “INSTITUTION SCREENING PARAMETERS” page shows the list of parameters that have been entered into the software and their scan status.
How to view the Institution Screening scan explorer
Step 1: Click on the Institution Screening dropdown button and select the “Scan Explorer” option.
The above action will display a page as seen in the image below.
The Scan Explorer provides details of scan results across the entered date ranges. These results can be filtered down to only results that are meaningful to you by applying various scan filters.
The function of the scan filters is explained below;
Start Date and End Date: These fields allow you to filter the list of scan results to a specific date range. The date range refers to the dates the parameters were scanned. This filter is mandatory.
Category: To view scan results having the same Category, select the desired Category from the Category dropdown and click on the View button.
Reasons: To view scan results having the same scan reason, select the desired Reason from the Reasons dropdown and click on the View button.
Entries: The number of scan results to see on the page.
Search: To search for the parameter(s).
L. Score and H. Score: The low score and high score work together to filter the results based on score prediction. The L. Score entered must be less than the H. Score. After entering your desired score prediction range, click on the View button to see the result.
Export To Excel: To export the list of scan results to Excel, click on the ‘Action‘ dropdown button and select “Export To Excel.”
The data representation of the columns is explained below;
Account Number: The account number that the scan parameter matched.
Account Name: The account name that the scan parameter matched.
Date Opened: The date the matched account was opened.
Date Closed: The date the matched account was closed(This field is empty if the account is still open).
Account Status: The status of the matched account.
Scan Parameter: The actual scan parameter entered into the system
Scan Category: The category the scan parameter falls under. e.g Name, BVN, Email, etc…
Scan Prediction: The system’s prediction score for each parameter.
Scan Reason: The reason entered alongside the scan parameter.
Scan Date: The date the parameter was scanned.
How to view the Institution Screening scan summary
Step 1: Click on the Institution Screening dropdown button and select the “Scan Summary” option.
The above action will display a page as seen in the image below.
TOTAL PARAMETERS: This Section Value quickly informs the reviewer of the number of parameters uploaded to the system for scanning/screening.
Parameters could be BVN, NAMES, ID Numbers, PHONE NUMBERS, or EMAILS.
TOTAL SCANNED PARAMETERS: This Section Value informs the reviewer how many parameters have been scanned thus far. This number would increase daily.
TOTAL SCANNED RESULTS: This Section Value informs the reviewer how many results are present from all parameters that have been scanned.
TOTAL SCANNED RESULTS(LAST 24 HRS): This Section Value informs the reviewer of the total number of new results from the scan conducted in the last 24 hours.
This aids the reviewer who may be reviewing on a daily basis, focusing on the newer scans and helping to attain a thorough review process. There are explorers where these scan results can be targeted by the date the software entered them.
TOTAL HIGH PREDICTIONS(LAST 24 HRS): This Section Value plays a very important role as the software uses artificial intelligence and Machine Learning to learn the data from Scan results and give scores on how sure it is about the matches. The lowest score is 1, and the highest is 100.
100 means that the software is extremely confident that the scan result (a customer’s account) is an exact match to the scanned parameter.
This enables the reviewer to focus more closely on high matches and easily sort them out, thereby avoiding time wasted on false positives.
The software categorizes HIGH PREDICTIONS as scan results that score 80 and above. Further, high predictions for the last 24 hours indicate how many records should be prioritized from the total scanned results in that period.
This further streamlines the review process. Predictions in this category are colored red for easy identification.
TOTAL MEDIUM PREDICTIONS(LAST 24 HRS): The software categorizes MEDIUM PREDICTIONS as scan results that score between 50 and 79. Predictions in this category are colored yellow for easy identification.
TOTAL LOW PREDICTIONS(LAST 24 HRS): The software categorizes LOW PREDICTIONS as scan results that score between 1 and 49. Predictions in this category are colored blue for easy identification.
HIGH PREDICTIONS%(LAST 24 HRS): This tells the percentage of high predictions in the scan results from scans conducted in the last 24 hours.
MEDIUM PREDICTIONS% (LAST 24 HRS): This indicates the percentage of medium predictions in the scan results from the last 24 hours.
LOW PREDICTIONS%(LAST 24 HRS): This tells the percentage of low predictions in the scan results from scans conducted in the last 24 hours. The software assigns a special prediction score of 81 to scan parameters it detects, naming individuals that match the Signatory/Director of corporate accounts. With the software’s artificial intelligence and machine learning capabilities to scan and predict the probability of match accuracy in scores, reviewing these scan results is easier than expected.
Note: This operation requires the Administrator or Auditor permission.
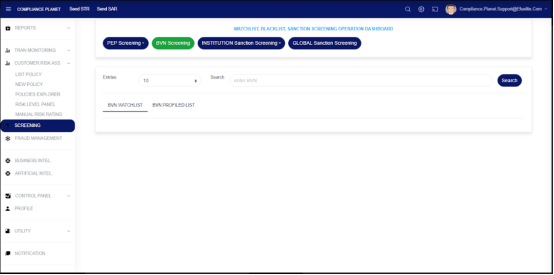
The BVN screening helps scan an institution for a match; it also indicates whether the search parameter (BVN) has already been profiled under the BVN Watchlist in the system, by displaying the account(s) the BVN is tied to.
STEP 1: From the left-hand side menu, click “SCREENING” as seen below.
STEP 2: From the left-hand side menu, click “BVN Screening” as seen below.
On the above page, enter a BVN in the Search field and click on the Search button to perform an instant search.
BVN WATCHLIST: This tab shows the account(s) tied to the searched BVN and profiled as watchlist at the institution.
BVN PROFILED LIST: This tab shows account(s) that the searched BVN is tied to, irrespective of whether the BVN is profiled under the watch list or not.
Note: This operation requires the Administrator or Auditor permission.
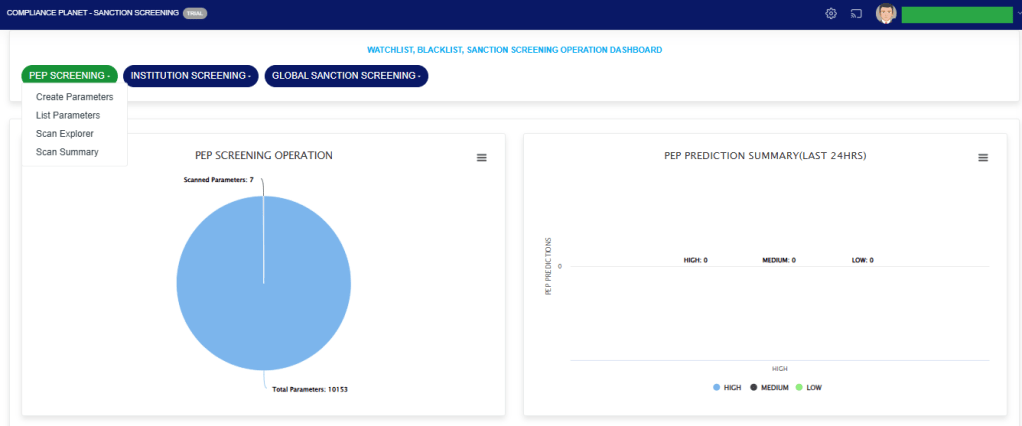
The PEP screening helps scan an institution for likely PEPs, and if a match is found, it further indicates whether the Scan Results (a customer account) has already been profiled as a PEP in the system or not.
How to Create a Screening Parameter
STEP 1: From the app dashboard, click “SANCTION SCREENING” as seen below.
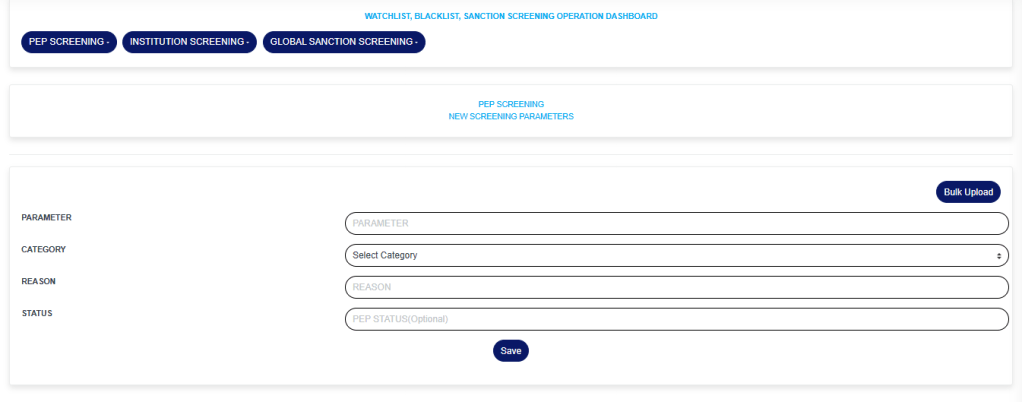
STEP 2: From the top menu, click “PEP Screening.” This action will display a dropdown menu, as seen in the image below. From the dropdown menu, click “Create Parameters”.
STEP 3: Fill in the fields on the NEW SCREENING PARAMETERS page.
PARAMETER: The parameter you want to scan
CATEGORY: The category of the parameter, this is a dropdown to select from.
REASON: The reason for scanning the parameter.
STATUS: The status of the PEP; this field is optional.
You can also bulk upload parameters already prepared in Excel by clicking the “Bulk Upload” button.
Click on the “Save” button to save the parameter.
Note: The category selected determines the parameter to enter. E.g., if the category selected is “NAME”, then the parameter should be a name. If the category selected is “EMAIL,” then the parameter should be an email address.
How to List PEP Screening Parameters
STEP 4: Click on “List Parameters” to see the list of parameters entered into the software.
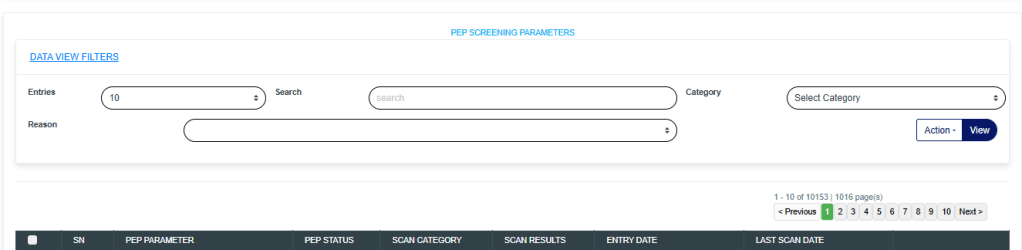
STEP 5: The “PEP SCREENING PARAMETERS” page shows the list of parameters that have been entered into the software and their scan status.
Select Category: To view parameters having the same Category, select the desired Category from the Select Category dropdown and click on the View button.
Instant Scan: To instantly scan a parameter, click on the “Scan” button for the parameter you want to instantly scan. This will perform an instant scan of the parameter, and the “Scan Result Column” will be updated in real-time for the parameter.
Reasons: To view parameters having the same scan reason, select the desired Reason from the Reasons dropdown and click on the View button.
Entries: The number of parameters to see on the page.
Search: To search for the parameter(s).
Export To Excel: To export the list of parameters to Excel, click on the ‘Action‘ dropdown button and select “Export To Excel.”
Delete Parameter(Single): To delete a parameter, click the red “Delete” button on the parameter you want to delete.
Delete Parameter(Bulk): To bulk delete parameters, select the parameters you want to delete by checking the checkbox on each row(This checkbox is before the SN column. After checking the boxes, click on the ‘Action‘ dropdown button and select “Delete Selected Records.”
The Scan Results Column in the table shows the number of matches found for a parameter. To view the results, click on the result number.
How to view the PEP scan explorer
Step 1: Click the PEP Screening dropdown and select “Scan Explorer”.
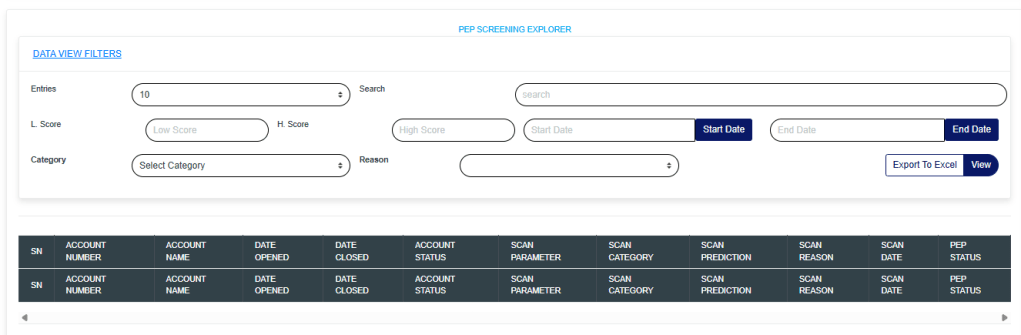
The action above will display a page, as shown in the image below.
The Scan Explorer provides details of scan results across various date ranges. These results can be filtered down to only results that are meaningful to you when applying various scan filters.
The function of the scan filters is explained below;
Start Date and End Date: This filters the scan results list to a desired date range. The date range refers to the dates the parameters were scanned. This filter is mandatory.
Category: To view scan results having the same Category, select the desired Category from the Category dropdown and click on the View button.
Reasons: To view scan results having the same scan reason, select the desired Reason from the Reasons dropdown and click on the View button.
Entries: The number of scan results to see on the page.
Search: To search for the parameter(s).
L. Score and H. Score: The low score and high score work together to filter the results based on score prediction. The L. Score entered must be less than the H. Score. After entering your desired score prediction range, click the View button to see the result.
Export To Excel: To export the list of scan results to Excel, click on the ‘Action‘ dropdown button and select “Export To Excel.”
The data representation of the columns is explained below;
Account Number: The account number that the scan parameter matched.
Account Name: The account name that the scan parameter matched.
Date Opened: The date the matched account was opened.
Date Closed: The date the matched account was closed(This field is empty if the account is still open).
Account Status: The status of the matched account.
Scan Parameter: The actual scan parameter entered into the system
Scan Category: The category the scan parameter falls under. e.g. Name, BVN, Email, etc…
Scan Prediction: This is the system prediction score for each parameter.
Scan Reason: This is why it was entered alongside the scan parameter.
Scan Date: The date the parameter was scanned.
How to View the PEP Scan Summary
Step 1: Click the PEP Screening dropdown and select the “Scan Summary” option.
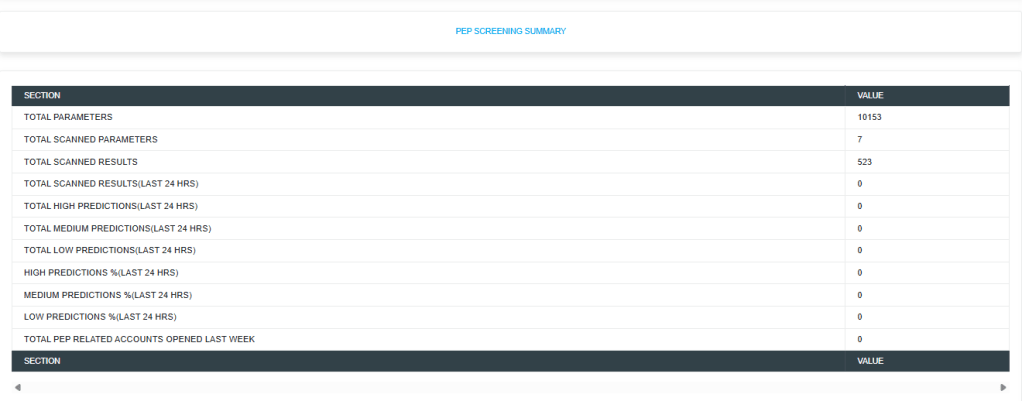
The action above will display a page, as shown in the image below.
TOTAL PARAMETERS: This Section Value quickly informs the reviewer of the number of parameters uploaded into the system for scanning/screening purposes.
Parameters include BVN, NAMES, ID Numbers, PHONE NUMBERS, or EMAILS.
TOTAL SCANNED PARAMETERS: This Section Value informs the reviewer how many parameters have been scanned thus far. This number would increase daily.
TOTAL SCANNED RESULTS: This Section Value informs the reviewer how many results are present from all parameters that have been scanned.
TOTAL SCANNED RESULTS(LAST 24 HRS): This Section Value informs the reviewer of the total number of new results from the scan conducted in the last 24 hours.
This aids the reviewer who may be reviewing daily scans, focusing on the newer ones, and helping to achieve a thorough review process. There are explorers where these scan results can be targeted by the date the scan results were entered by the software.
TOTAL HIGH PREDICTIONS(LAST 24 HRS): This Section Value plays a very important role as the software uses artificial intelligence and Machine Learning to learn the data from Scan results and give scores on how sure it is about the matches. The lowest score is 1, and the highest is 100.
100 means that the software is extremely confident that the scan result (a customer’s account) matches the scanned parameter.
This enables the reviewer to focus more closely on high matches and easily sort them out, thereby avoiding time wasted on false positives.
The software categorizes HIGH PREDICTIONS as scan results that score 80 and above. Furthermore, providing high predictions for the last 24 hours informs the reviewer how many records should be prioritized out of the total scanned results from the previous 24 hours.
This further makes the review process faster. Predictions in this category are colored red for easy identification.
TOTAL MEDIUM PREDICTIONS(LAST 24 HRS): The software categorizes MEDIUM PREDICTIONS as scan results that score between 50 and 79. Predictions in this category are colored yellow for easy identification.
TOTAL LOW PREDICTIONS(LAST 24 HRS): The software categorizes LOW PREDICTIONS as scan results that score between 1 and 49. Predictions in this category are colored blue for easy identification.
HIGH PREDICTIONS%(LAST 24 HRS): This tells the percentage of high predictions in the scan results from scans conducted in the last 24 hours.
MEDIUM PREDICTIONS% (LAST 24 HRS): This indicates the percentage of medium predictions in the scan results from scans conducted within the last 24 hours.
LOW PREDICTIONS%(LAST 24 HRS): This tells the percentage of low predictions in the scan results from scans conducted in the last 24 hours. The software assigns a special prediction score of 81 to scan parameters it detects, naming individuals that match the Signatory/Director of corporate accounts. With the software’s artificial intelligence and machine learning, scanning and predicting the probability of match accuracy in scores makes reviewing these scan results easier than expected.
TOTAL PEP-RELATED ACCOUNTS OPENED LAST WEEK: This tells the number of PEP-related accounts opened in the last 7 days. The software periodically uses the BVN of already profiled PEPs to scan the institution CBA of accounts linked to the profiled PEPs’ BVN and automatically profiles them as PEPs.
These profiled PEPs are available in the PEP Account Repository. The link below talks about how to view these profiled PEPs.
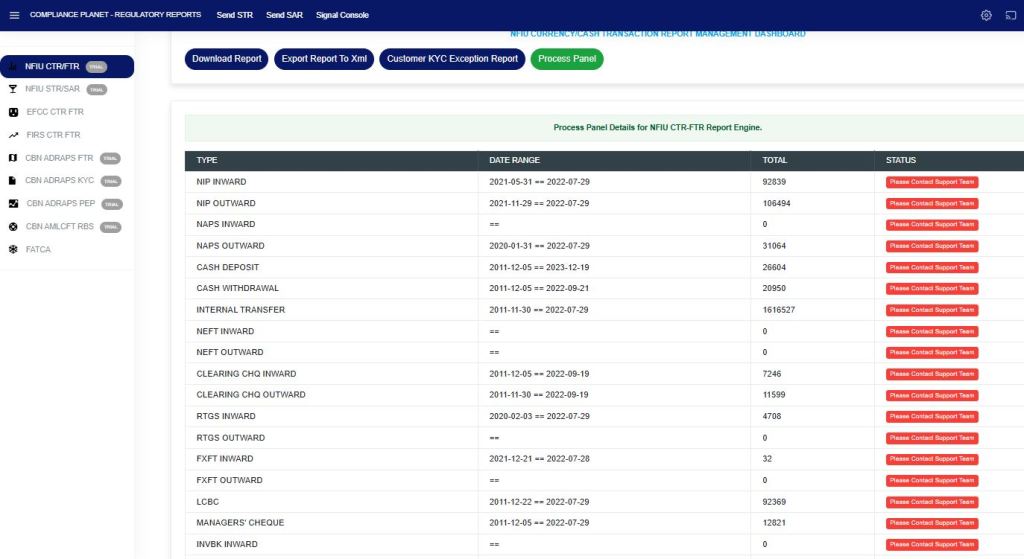
The CTR/FTR process panel presents all transaction types, their date ranges, and the number of transactions for each type that have been processed on the Compliance Planet. The date range on the planet refers to the earliest and latest dates of transactions processed in the Compliance planet.
Note: Only persons assigned the right(s) to ‘view CTR reports’ and ‘process CTR reports’ will be able to carry out this operation.
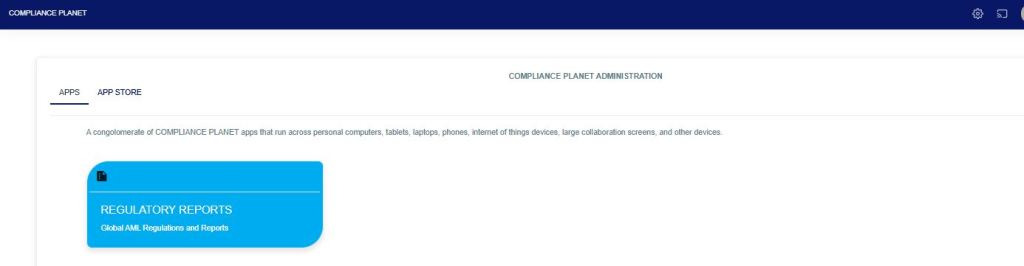
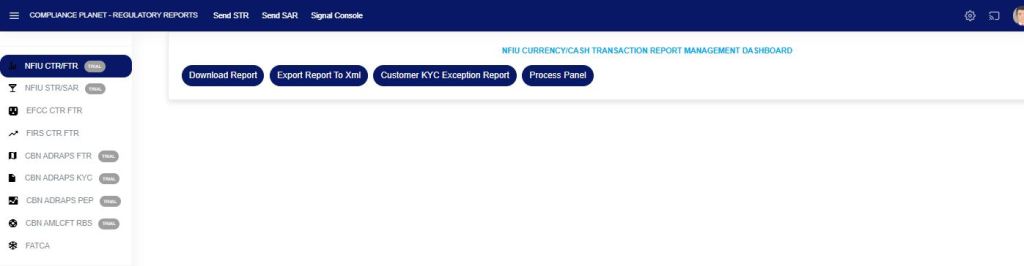
From the app dashboard, click on “REGULATORY REPORTS” as shown below
Click on ‘NFIU CTR/FTR’ on the drop-down list. See an example in Fig below. This will display the NFIU CTR/FTR page.
Fig
From the menu, click on “Process Panel”, which will display all the transaction types, date range, total records, and status, as shown in the Fig below.
1. Idle time Out: This is the maximum period users can stay without interacting with the software. When this feature is activated, users will be automatically logged out after a specified period of inactivity.
2. App Session Life Span: This is the maximum period a user’s session can last, i.e., a user will be automatically logged out once the set life span elapses. Note that a session starts when a user logs into the software and ends when the user logs out.
3. Multiple User Sessions: This determines if the user will be permitted to log into the software on more than one browser, tab on a browser, or device at the same time.
NOTE: Only administrators can carry out these operations
Follow the Steps below to perform the operations listed above in the Compliance Planet AML software.
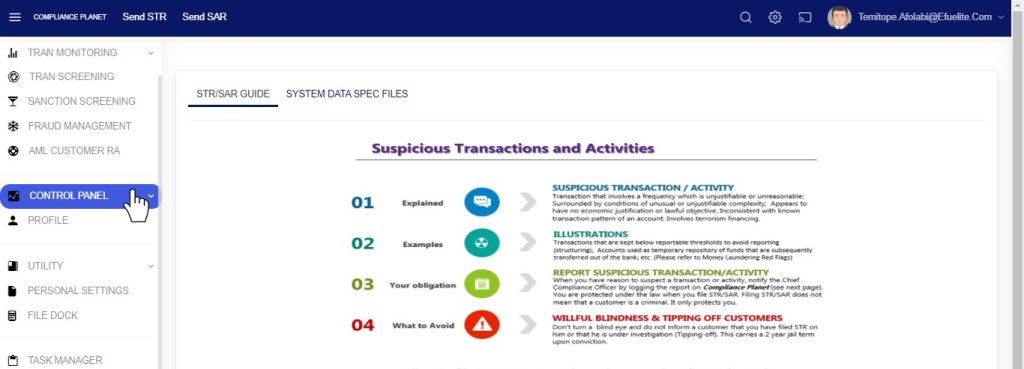
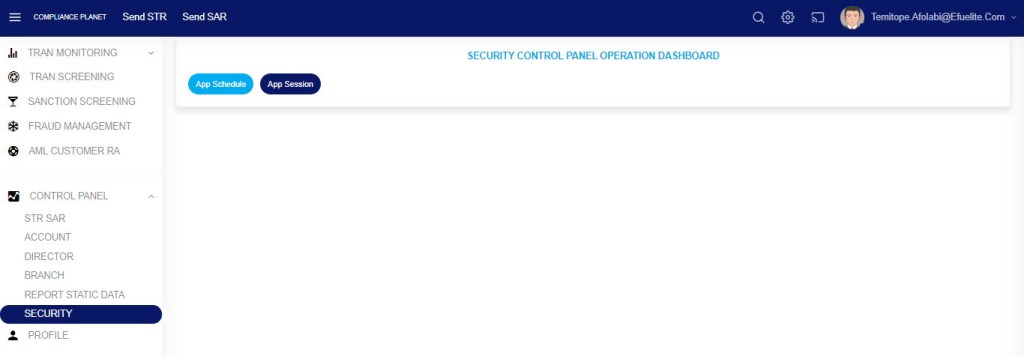
From the left-hand side menu click “Control Panel” as in fig below.
This will display a drop-down as in fig below
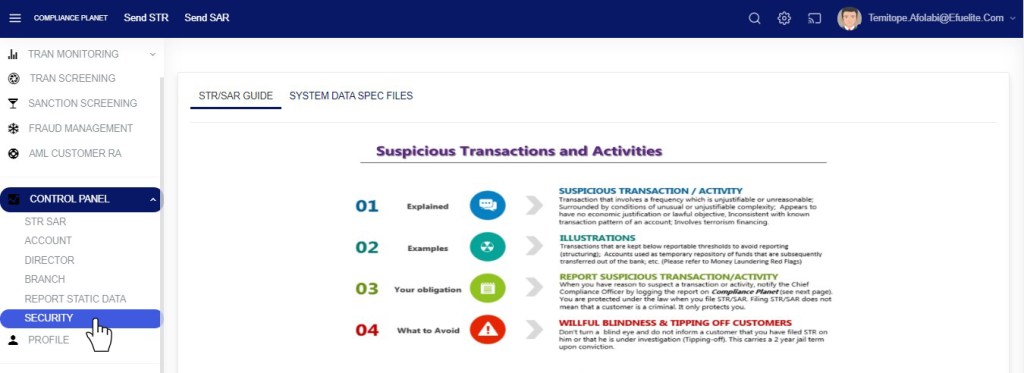
Click “Security” from the control panel drop-down as in fig below
This will display a SECURITY CONTROL PANEL OPERATIONS DASHBOARD as in fig below
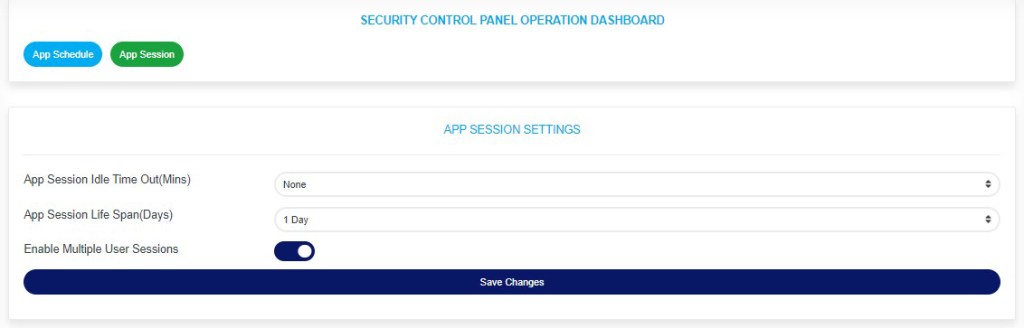
STEP 1: Click “App Session” from the top menu on the SECURITY CONTROL PANEL DASHBOARD. See an example in fig 39.2a below.
Fig 39.2a
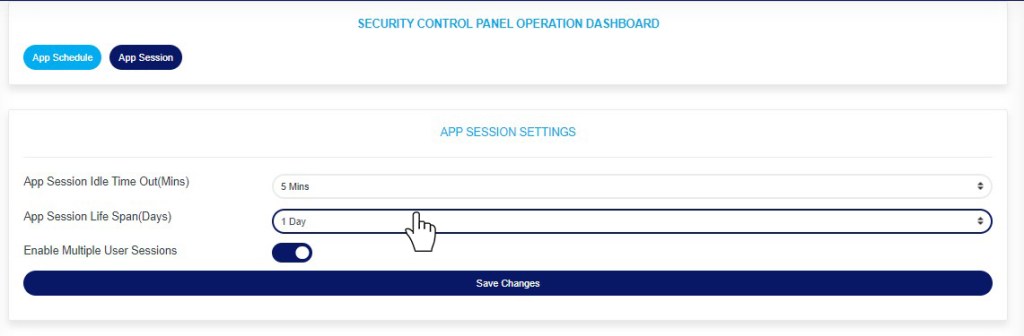
This displays a page as in fig 39.2b below
Fig 39.2b
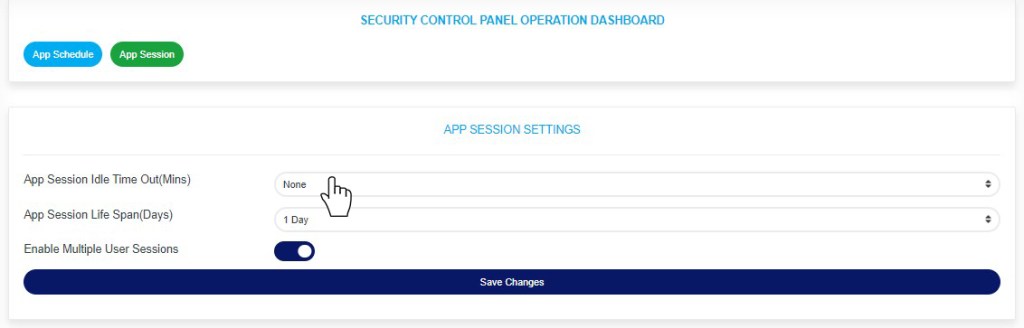
STEP 2: Click the “App Session Idle Time Out (Mins)” box as in Figure 39.2c below.
Fig 39.2c
This displays a drop-down as in fig 39.2d below.
STEP 3: Select your preferred idle time-out duration in minutes, as in Fig. 39.2d below.
Note that selecting “None” will deactivate the idle time-out feature.
Fig 39.2d
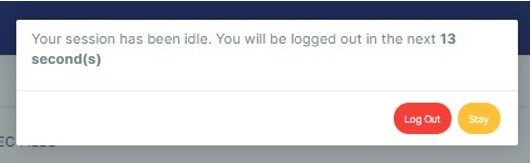
A timer console will be displayed as soon as the set maximum idle time remains 1 minute. The time will count down to zero, and if the user does not interact with the software before it gets to zero, the user will be logged out of the application. See an example below
fig.27.3l
STEP 4: Click the “App Session Life Span (Days)” box as in Fig. 39.2e below.
Fig 39.2e
This displays a drop-down as in fig 39.2f below.
STEP 5: Select your preferred App Session Life Span duration in days as in fig 39.2f below.
Note: Selecting “None” will deactivate the App Session Life Span feature
Fig 39.2f
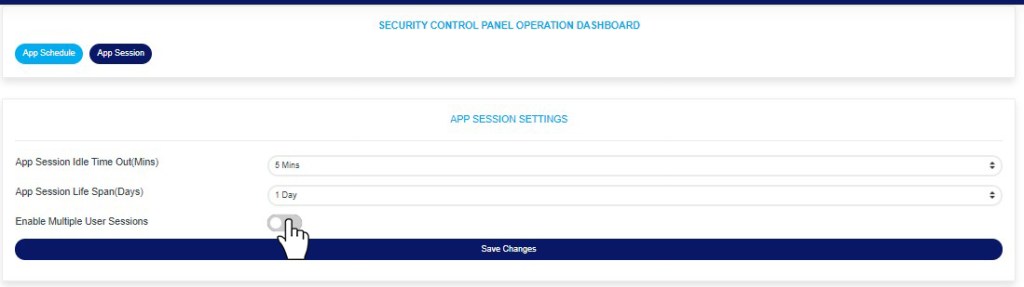
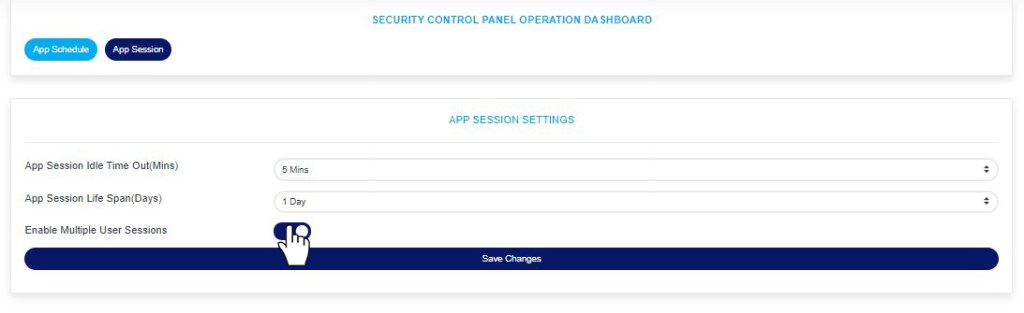
STEP 6: Toggle the “Enable Multiple User Sessions” box to either allow multiple user sessions or disallow multiple user sessions. See examples in fig. 39 .2 g and fig 39.2h below
Dis-enable Multiple User Sessions
Fig 39.2g
Enable Multiple User Sessions
Fig 39.2h
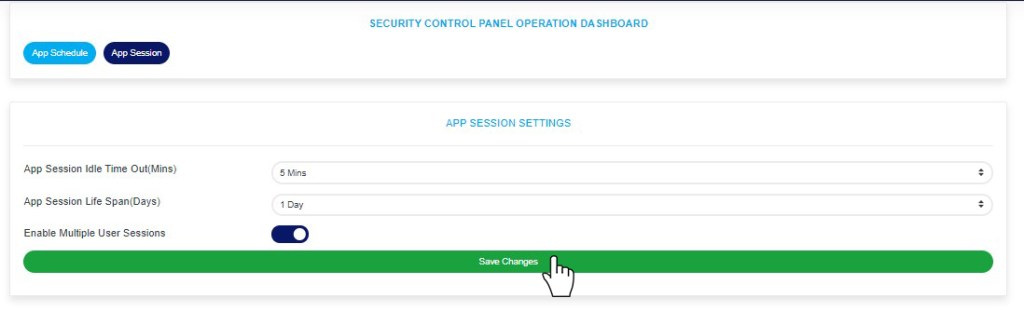
STEP 7: Click “Save Changes” as in fig 39.2h below to update the App Session Settings.
Fig 39.2i
This displays a confirmation console as in fig 39.2j below
STEP 8: Click “Confirm” to proceed or “Cancel” to close the console.
Fig 39.2j
This will display a notification at the top of the page showing that the app session settings have been successfully updated.
This section provides options to schedule the day(s) and hour(s) the Compliance Planet will be accessible for users. For example, the software can be scheduled to be accessible to users only on Monday to Friday (i.e., weekdays).
NOTE: Only administrators can carry out these operations
Follow the Steps below to set the App Schedule on the Compliance Planet AML software.
From the left-hand side menu click “Control Panel” as in fig below.
Fig 39.0a
This will display a drop-down as in fig below
Click “Security” from the control panel drop-down as in fig 39.0c below
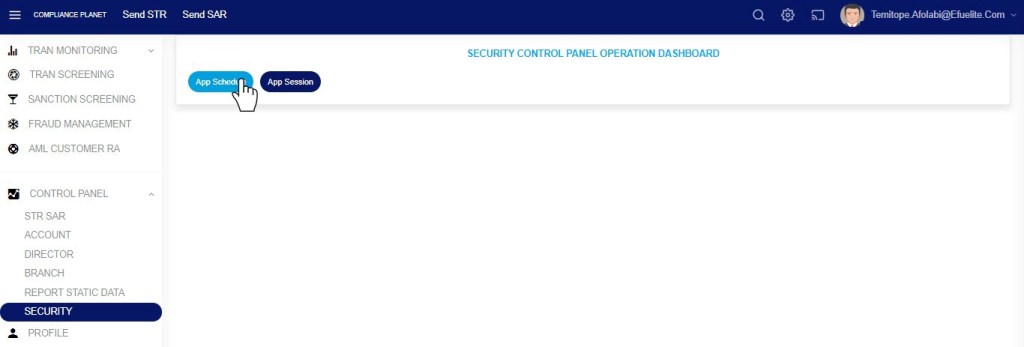
This will display a SECURITY CONTROL PANEL OPERATIONS DASHBOARD as in fig below
STEP 1: Click “App Schedule” from the top menu as in fig 39.1a below.
Fig 39.1a
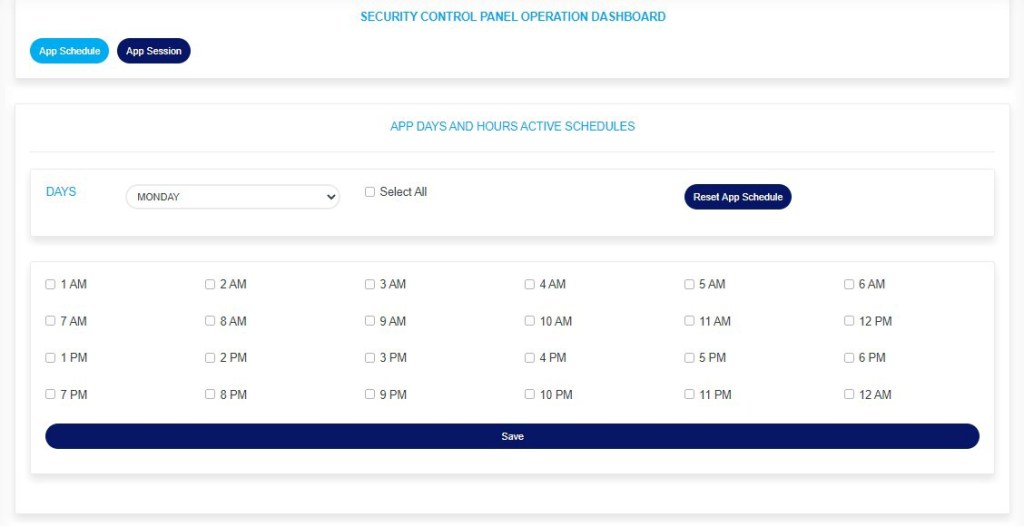
This displays a SECURITY CONTROL PANEL DASHBOARD as in as in fig 39.1b below.
Fig 39.1b
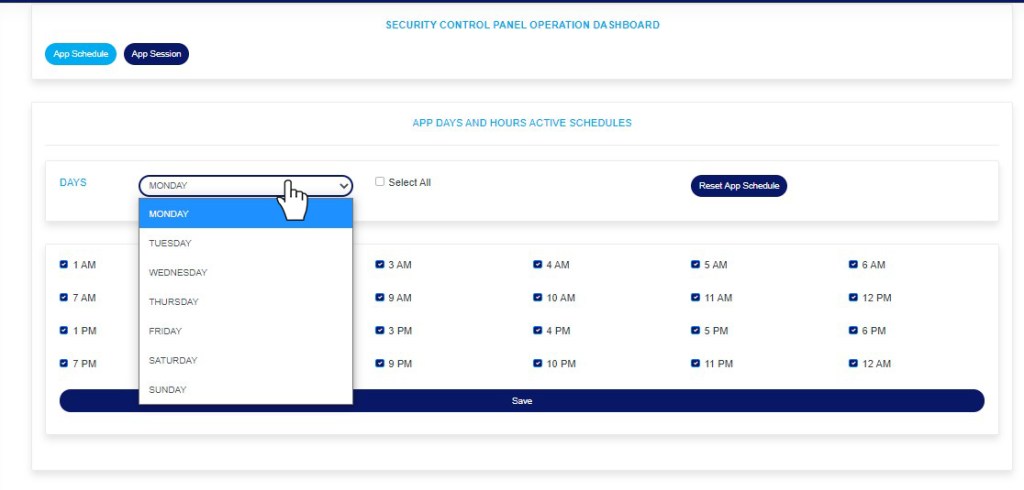
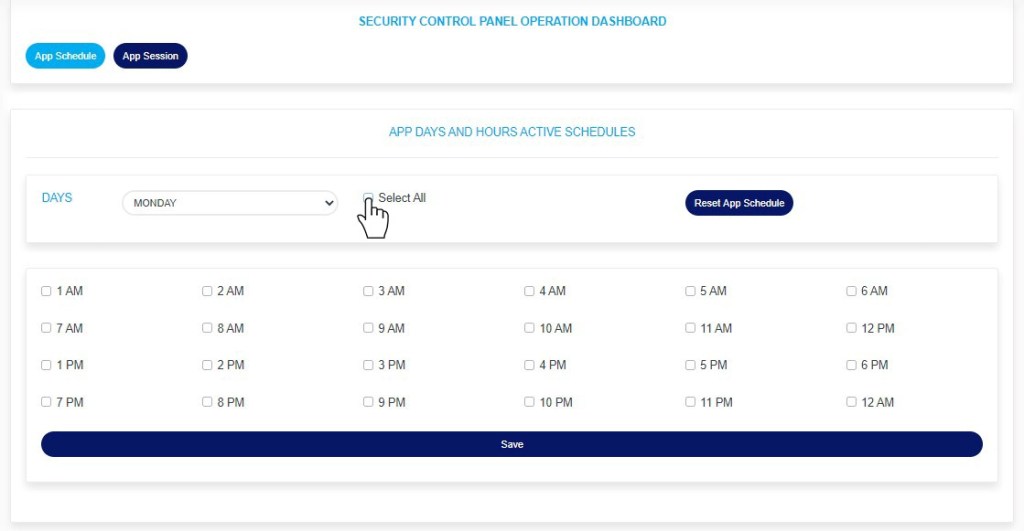
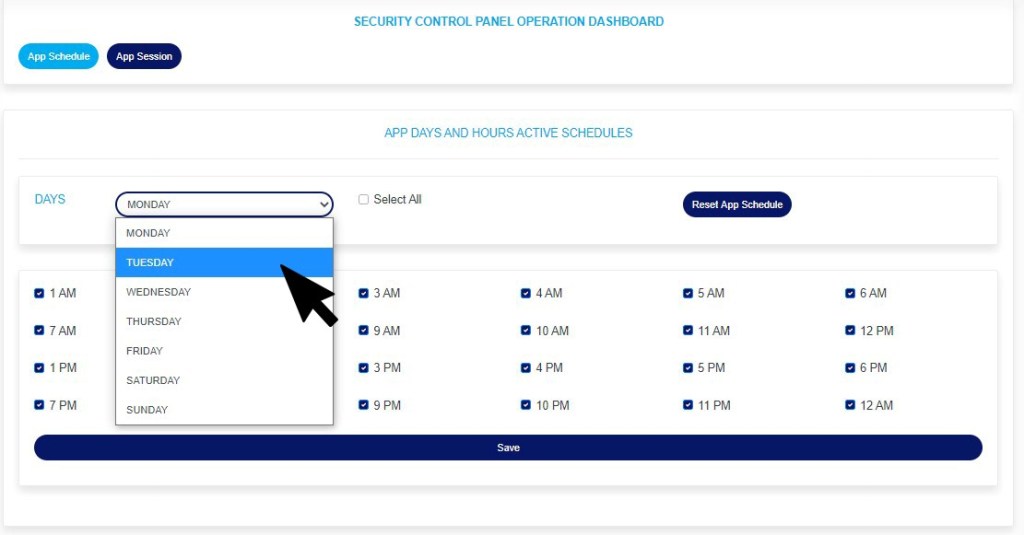
STEP 2: Click the “Days” box to select the day of a week. Here the setting is done for each day individually, so selecting a day of the week displays the hour(s) schedule settings for that day. See an example in fig 39.1c below
Fig 39.1c
STEP 3: Tick the checkbox for the hour(s) of the day you want the Compliance Plant AML software to be accessible for users. For example, in fig 39.1d below user’s will be granted access into the software from 1am to 11am on Mondays.
Fig 39.1d
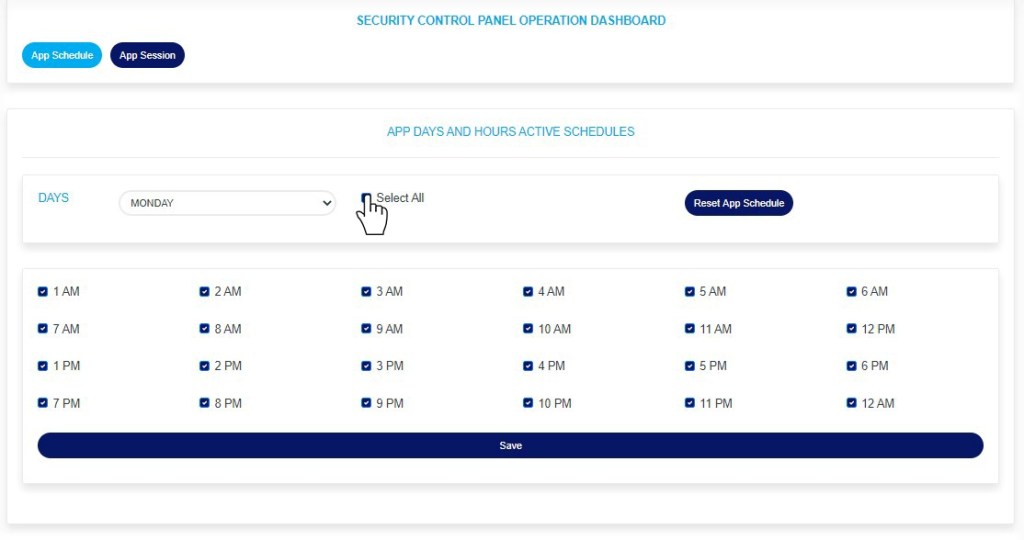
STEP 4: Tick the “Select all” checkbox at the top of the page to select all hours in the selected day. See an example in fig39.1e below
Fig 39.1e
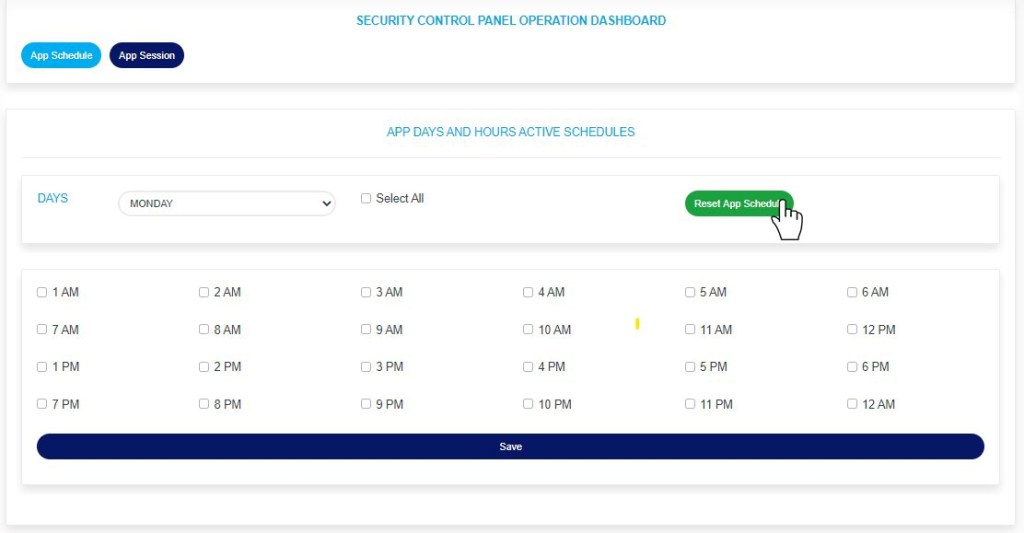
STEP 5: Untick the “Select all” checkbox at the top of the page to deselect all hours in the selected day. See an example in fig39.1f below
Fig 39.1f
STEP 6: Click “Reset App Schedule” to revert to default settings. Note that the default setting on the Compliance Planet AML Software schedule sets the app active for the whole day (i.e., all the hour checkboxes will be ticked)
Fig 39.1g
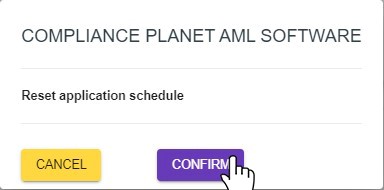
This will display a confirmation console as in fig 39.1h below
STEP 7: Click “Confirm” to proceed or “Cancel” to close the console.
Fig 39.1h
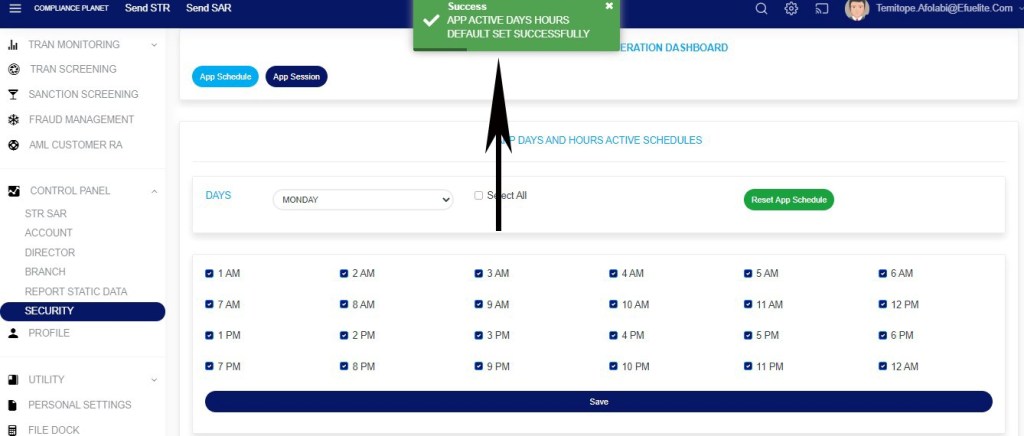
Clicking “Confirm” will display a notification at the top of the page as in fig 39.1i below
Fig 39.1i
STEP 8: Click “Save” as in fig 39.1j below to save the settings for the selected day (i.e. Monday in this example)
Fig 39.1j
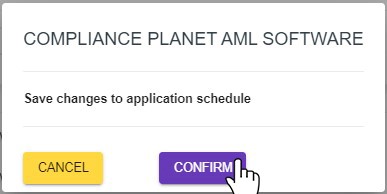
This will display a confirmation console as in fig 39.1k below
STEP 9: Click “Confirm” to proceed or “Cancel” to close the console.
Fig 39.1k
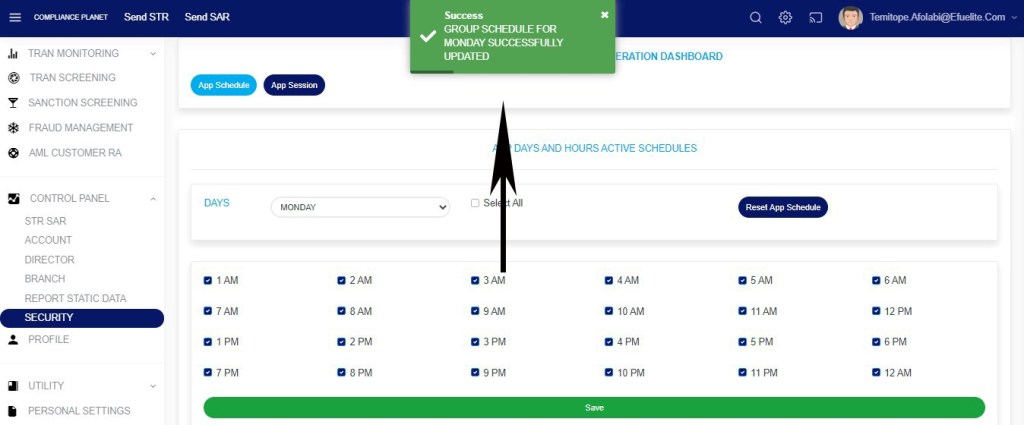
Clicking “confirm” will display a notification at the top of the page showing that the schedule for the selected day has been successfully updated.
Fig 39.1l
STEP 10: Click the “Days” box to select and edit the schedule for other days, then repeat steps 3 to 9 above.
Fig 39.1m
NOTE: This setting does not affect administrators.