The ‘notification’ section of the STR/SAR on the compliance planet handles the instant notification of the compliance team of a bank, upon the identification of a suspicious transaction or activity. Follow the following steps to send a STR Notification.
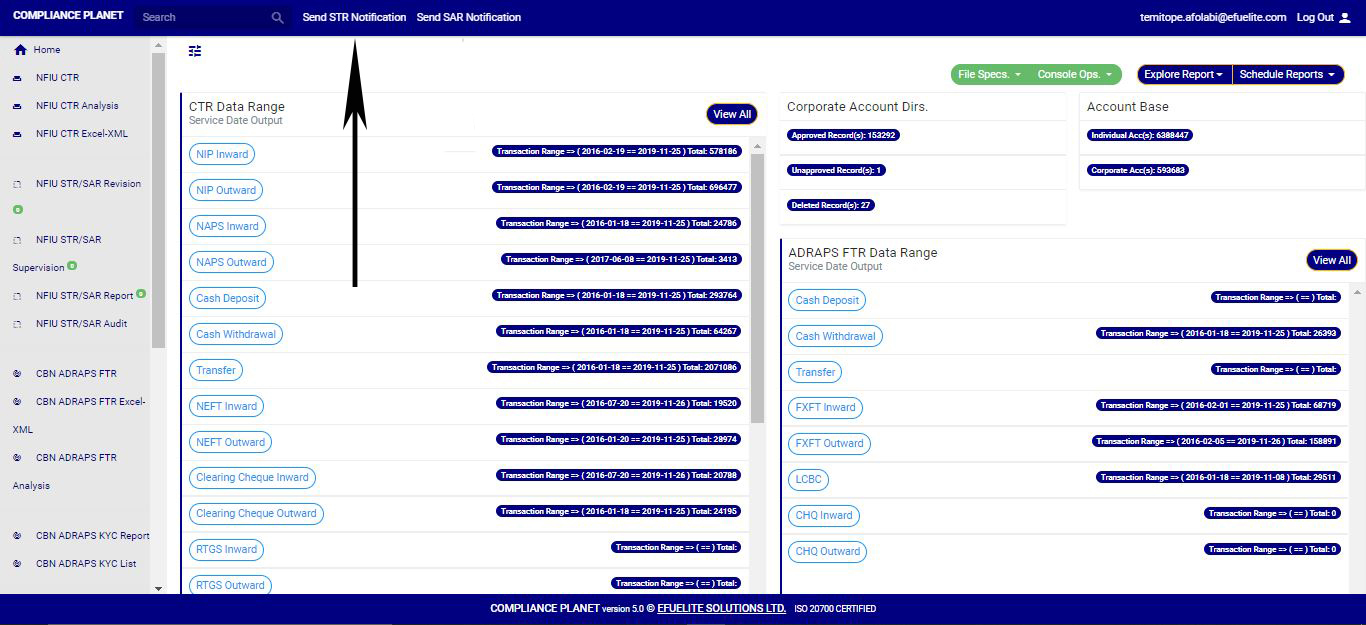
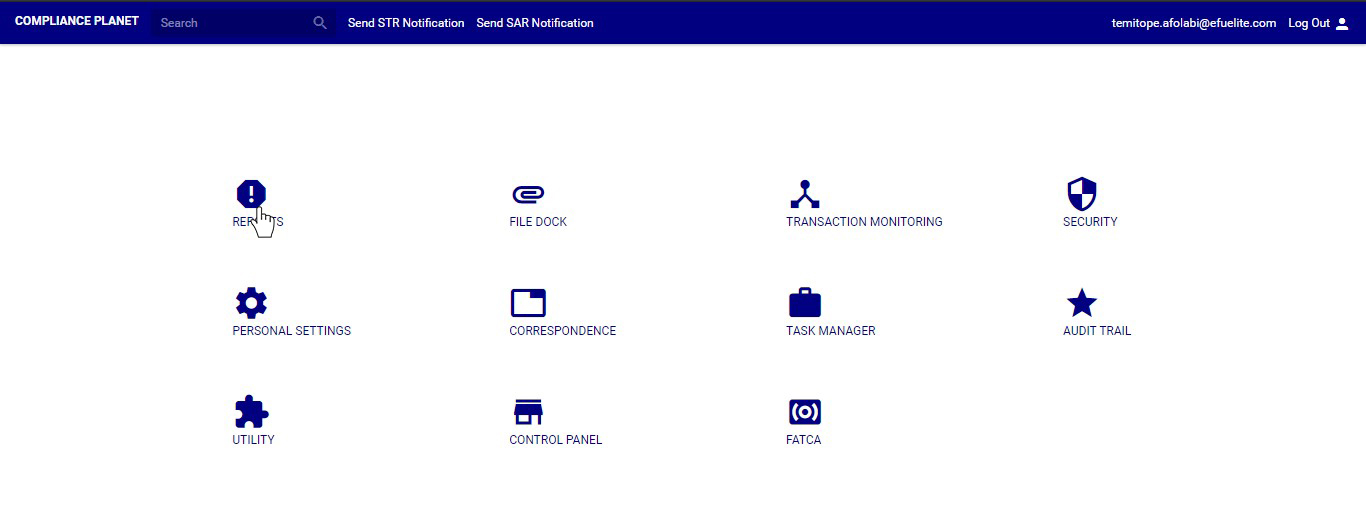
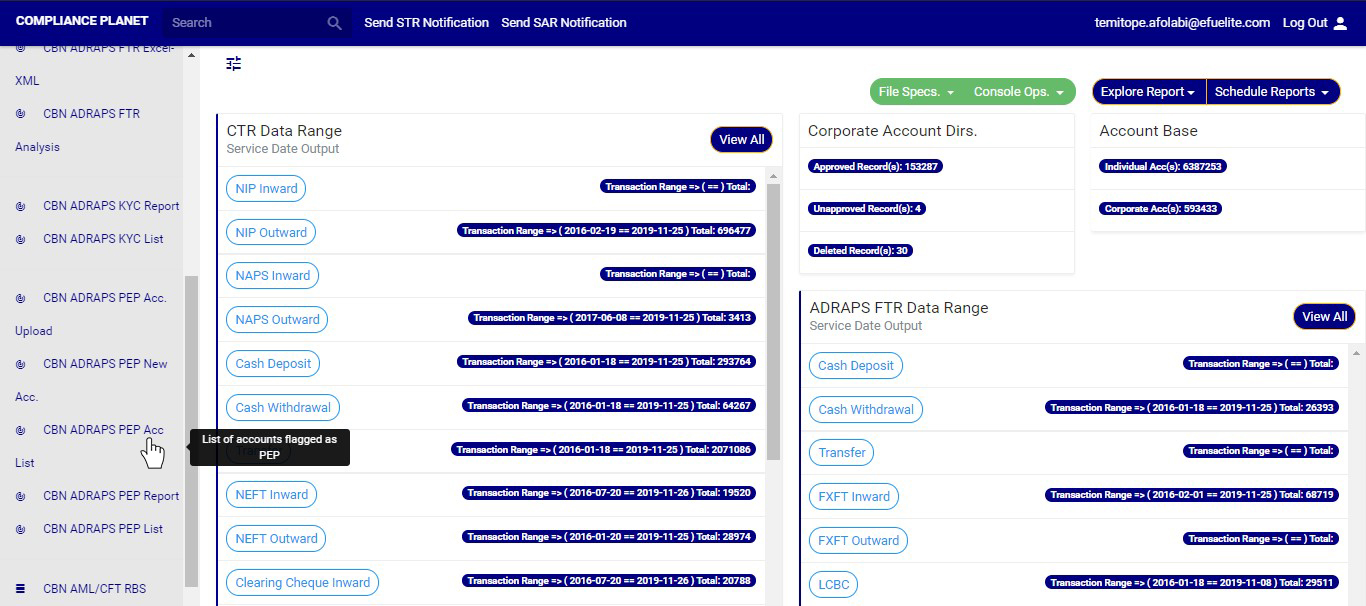
STEP 1: Click ‘Send STR notifications’ as in fig. 6.2.1a below
(fig. 6.2.1a)
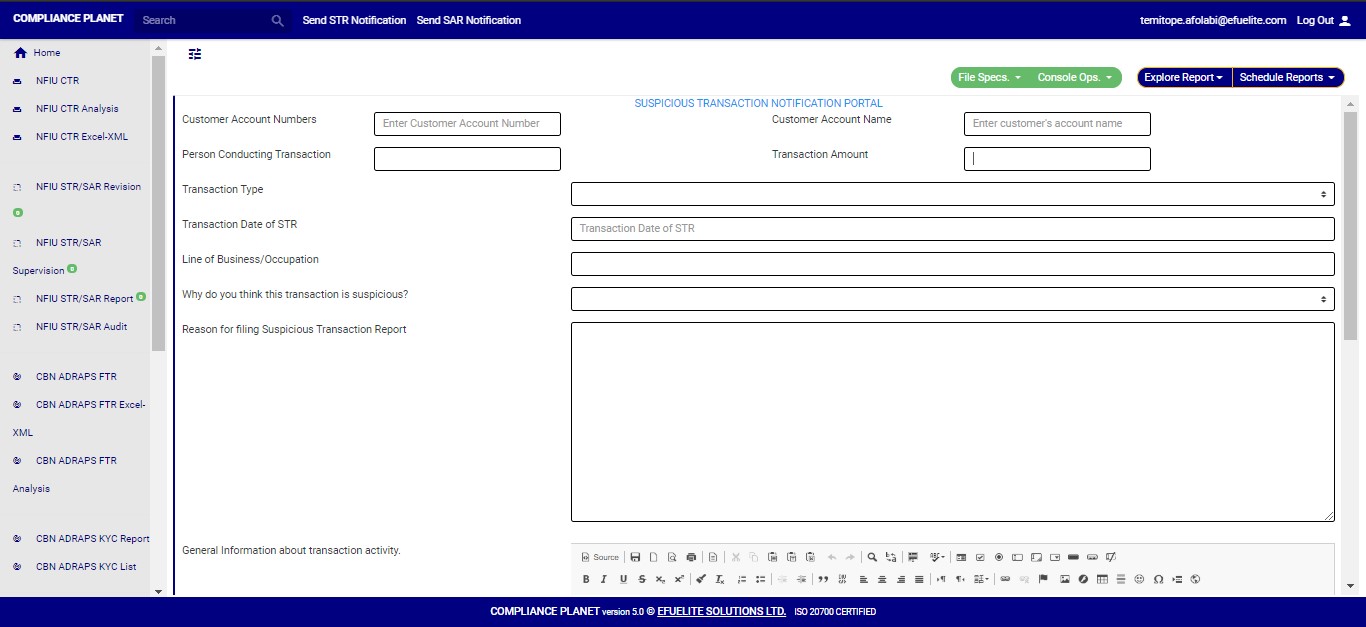
➔ Clicking on ‘SEND STR NOTIFICATIONS’ displays a console as in fig. 6.2b. It is the STR Notification console. The STR notification console requires information about the suspicious transaction.
(fig. 6.2.1b)
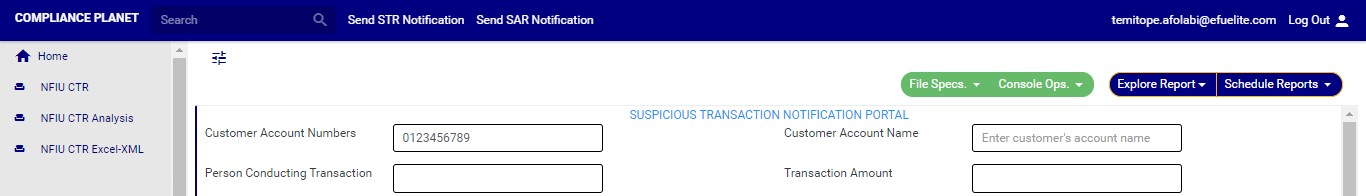
STEP 2: Type in the Account number involved in the transaction. See an instance in fig. 6.2.1c. Kindly note that the account number must be valid.
(fig. 6.2.1c)
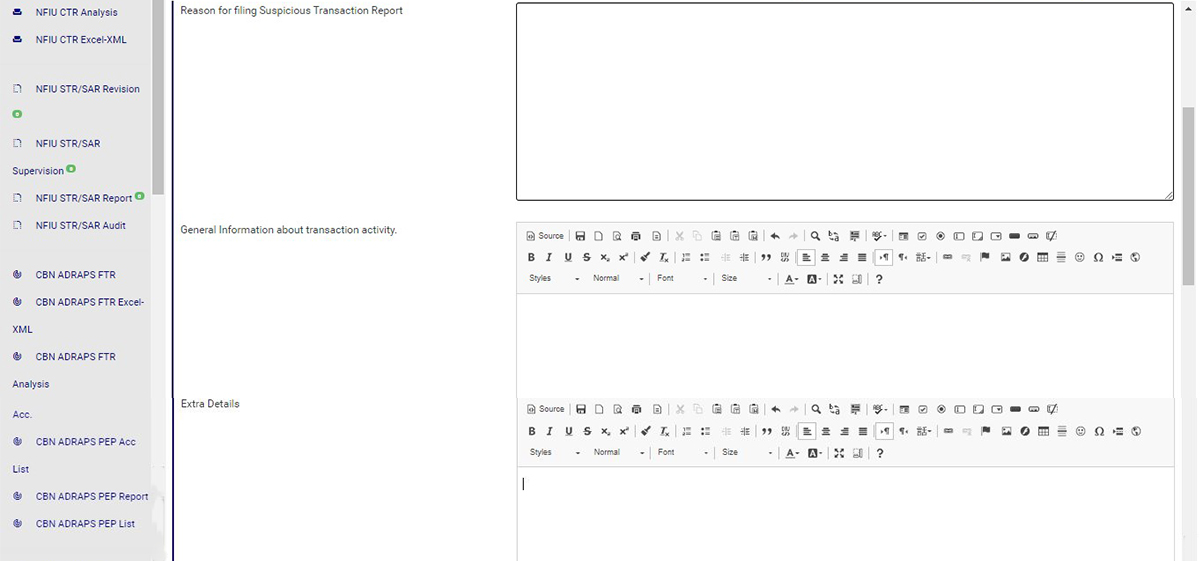
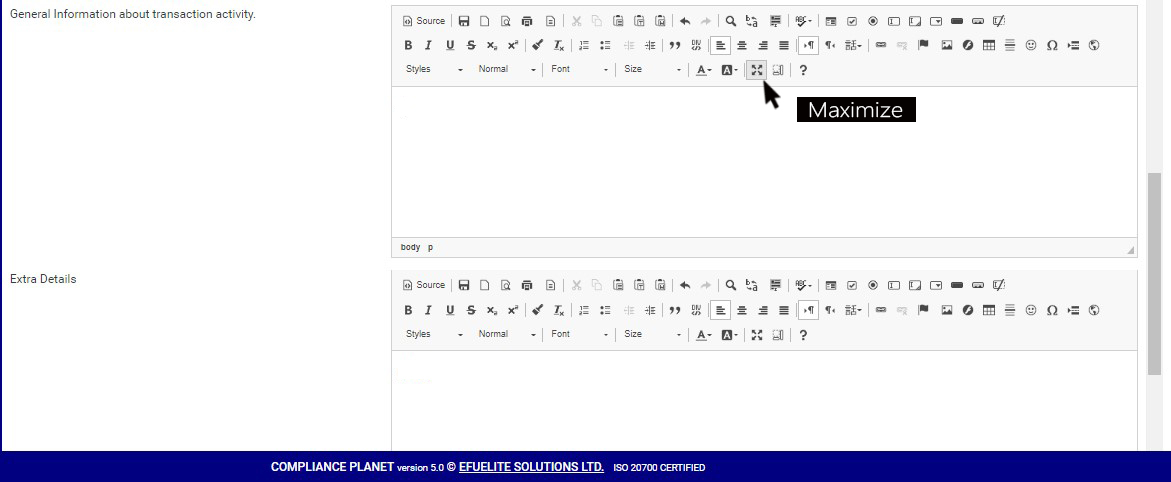
STEP 3: Fill in all other information about the transaction in the editor provided on the console. See an example in fig. 6.2.1d
(Fig. 6.2.1d)
➔ To fill the general information about the transaction and extra details section, there is a rich text editor which allows plain texts, characters and special features like tables, font style, colour, size, alignment, etc to format and customize the texts in your notification. See this feature in fig. 6.2.1e for an example.
(fig. 6.2.1e)
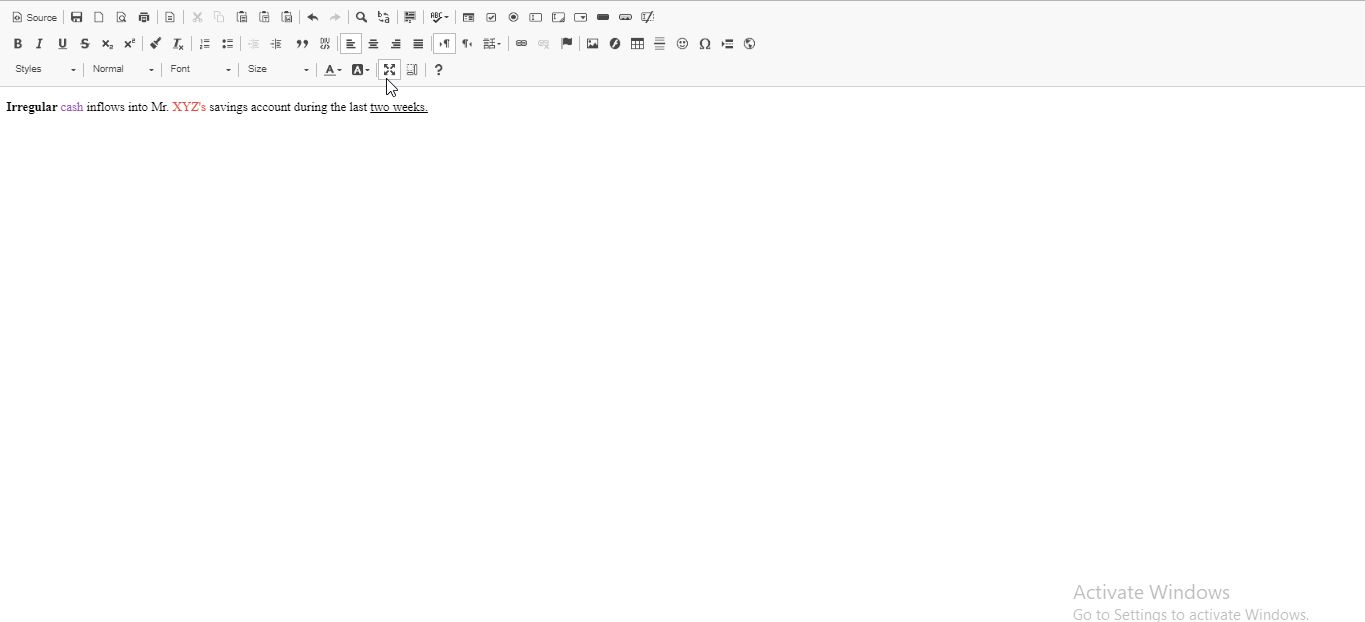
➔ Amongst the features on the toolbar of the editor, there is a button that can maximize the editor to full screen. This button also minimizes the editor’s view back to the console. See this button in fig. 6.2.1f and see fig. 6.2.1g for an example of a full screen view.
(fig. 6.2.1f)
(fig. 6.2.1g)
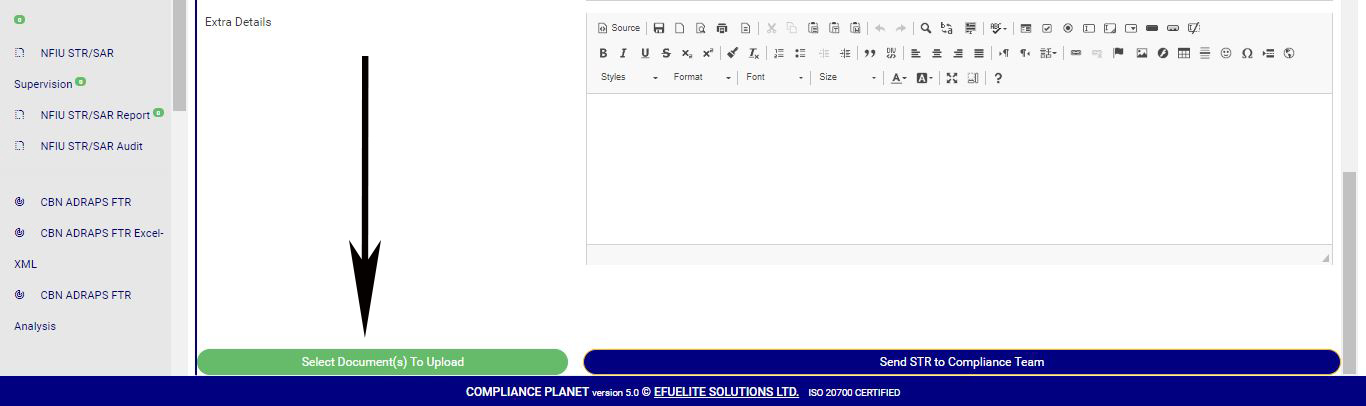
STEP 4: Click on “Select Document(s) to Upload” button to add supporting documents to the STR notification as shown in Fig.6.2.1h below
(fig. 6.2.1h)
➔ Click on ‘SEND STR TO COMPLIANCE TEAM’ to send the information to compliance desk. This button is at the bottom-right corner of the console. Check out this button in fig. 6.2.1h above.
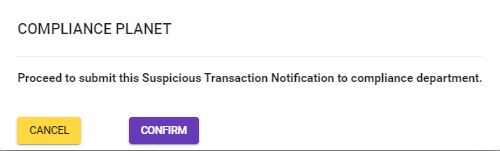
➔ A confirmation console will be displayed when you click on ‘SEND REPORT TO COMPLIANCE TEAM’. Click on CONFIRM to proceed or click on Cancel to go back to the notification console.
The compliance planet software keeps a record list of all KYC reports that have been manually scheduled. In this section, you will learn how to find your scheduled KYC report and some other features to give you the best experience.
NOTE; Only person(s) assigned right to ‘View KYC report’ can carry out this operation
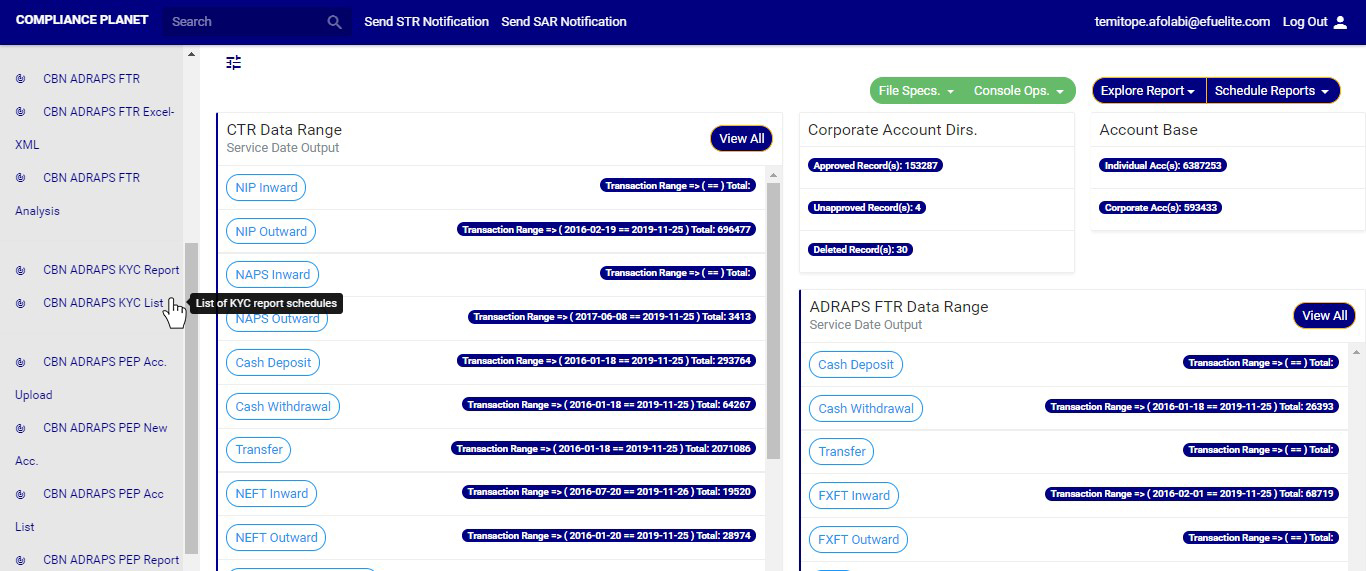
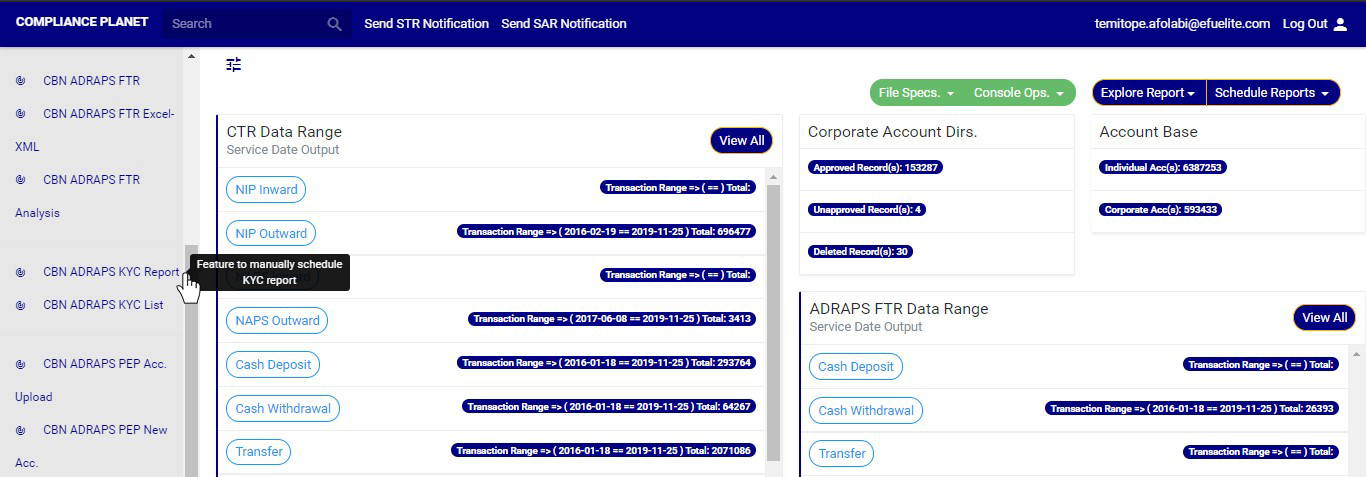
STEP 1: From the left hand side menu, click on ‘CBN ADRAPS KYC LIST’ Check out fig. 5.4a below.
(fig. 5.4a)
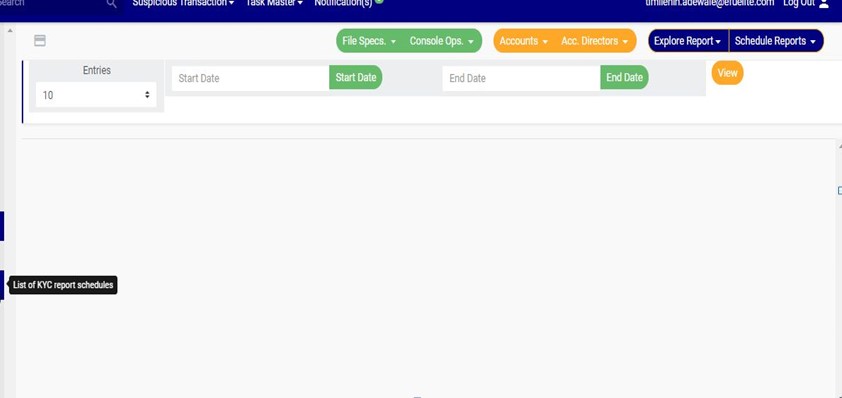
➔ Clicking on ‘KYC Repository LIST’ will display a page as in fig. 5.4b below. On this page, you can search out KYC reports by specifying periods in which they were scheduled for.
(fig. 5.4b)
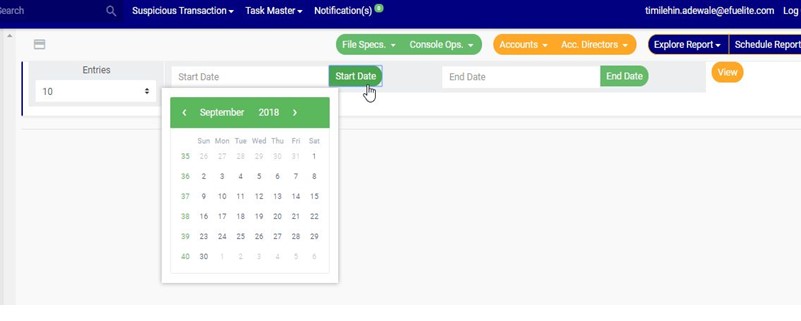
STEP 2: Click on the START DATE button/box and the END DATE button/box to set the beginning and the end of the period in which the reports you want to see have been scheduled for. See fig. 5.4c below for an example and check out fig. 5.3e to study the use of the calendar.
(fig. 5.4c)
➔ Take a look at the arrow labelled a to d in fig. 5.4d to study the calendar.
a) Click on the given year to change it to your year of choice.
b) Click on the given month to change it to your month of choice.
c) Then, click on the date of the month.
d) You can also click on the angle brackets on the calendar [ ‘’ ] to go backward or forward.
(fig. 5.4d)
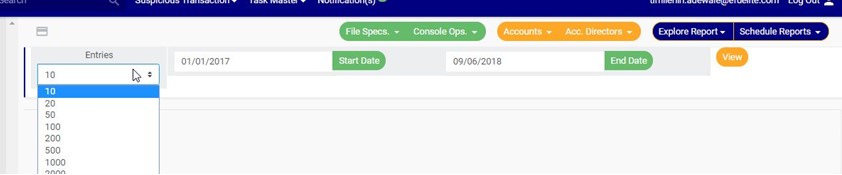
➔ You can increase the number of reports you want to see per page by clicking on the ENTRIES box. Pick any number of entries per page of your choice. See fig. 5.4e below for an example.
(fig. 5.4e)
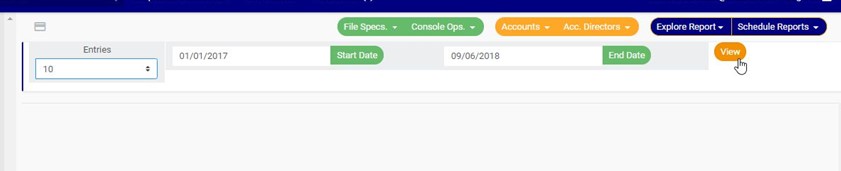
STEP 3: Click on the VIEW button to see the reports. It is an orange colour button at the upper area of the page, next to the END DATE box. By doing this, the software will search out reports that were scheduled for that period you have entered in the date boxes. See fig. 5.4f below to see the pointer clicking on the view button and see the results of the example in fig. 5.3g.
(fig. 5.4f)
(fig. 5.4g)
➔ The software will search out the requested reports and give information about the start and end date, the number of branches the account information relates to (Kiosk Rpt), the number of excel files and the XML files the report has been written into, the start date and end date for the processing of the report, the report type and whether the report has been completed or not. See fig. 5.4g above.
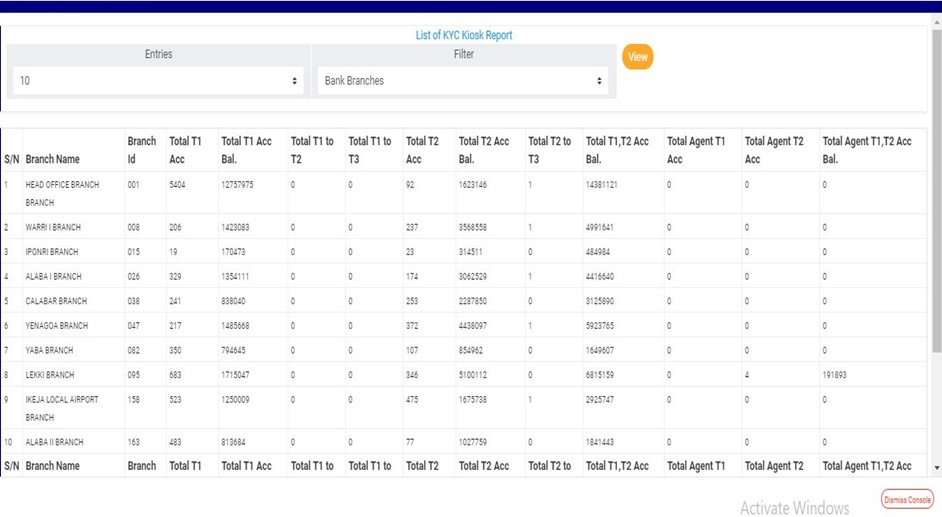
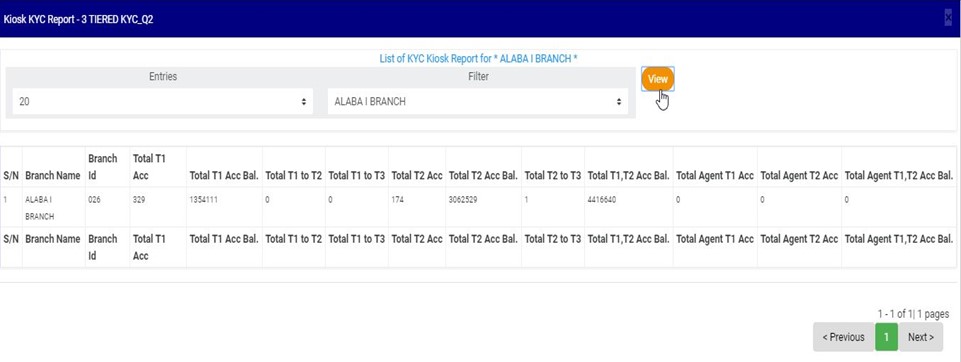
➔ The numbers under the Kiosk Rpt column represent the number of branches reported in the KYC report. By clicking on Kiosk Rpt., a page titled, Kiosk KYC Report, will come up. Another name for branch on the compliance planet is kiosk. This page gives information about the branch’s ID, number of tier one accounts and tier two accounts, their total account balances and number of accounts that moved from one tier to another, for each branch reported in the ADRAPS KYC. See fig. 5.4h below.
(fig. 5.4h)
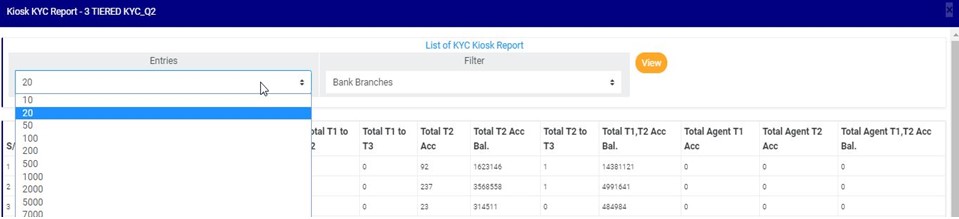
➔ See the following steps on how to make use of the features on the Kiosk KYC Report page.
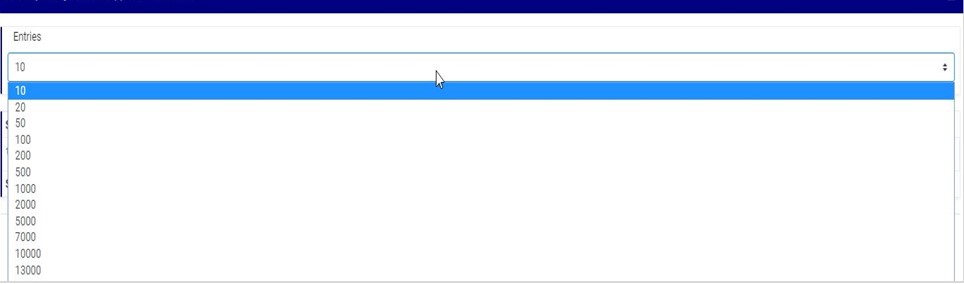
a) Click on the entries box to adjust the number of transactions you want to see per page. See fig. 5.4i below for an example on how to do this. The software will automatically effect your changes.
(fig. 5.4i)
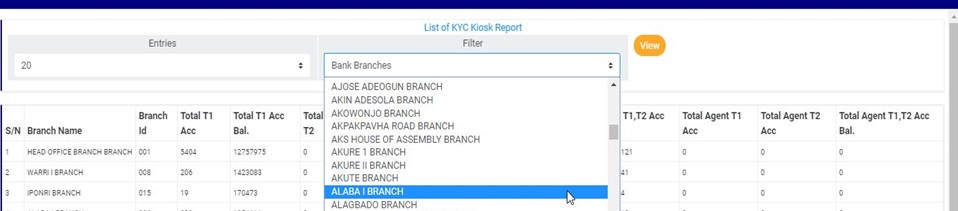
b) Click on the filter box to select a bank branch for which you want to see KYC information. See fig. 5.4j below for an example on how to do this.
(fig. 5.4j)
c) After selecting the bank branch of your choice as in fig. 5.4j above, click on VIEW to see the result of your selection. See fig. 5.4k for an example on how to do this.
(fig. 5.4k)
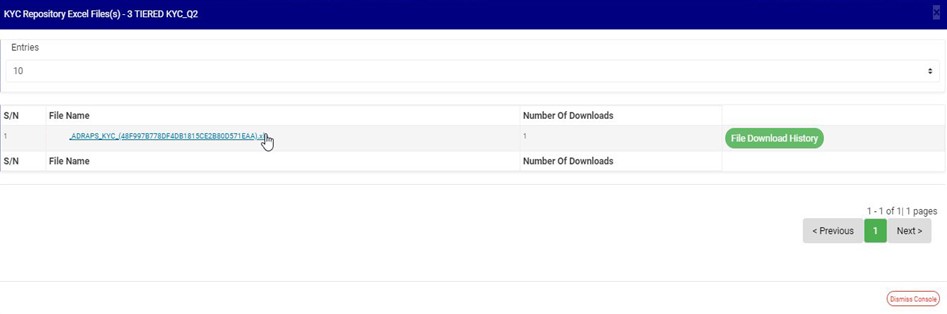
➔ The numbers under the ‘Excel’ column (in fig. 5.4g) also represent the number of Excel files that the software has written the report into. By clicking on the number of Excel files, the KYC Repository Excel file(s) console will be displayed on screen. See fig. 5.4l below for an example of the console.
(fig. 5.4l)
➔ The KYC Repository Excel file(s) page gives information about the Excel file name(s), the number of times users have downloaded the file and the download history. See the following steps on how to make use of its features.
a) Click on the entries box to adjust the number of Excel files you want to see per page. See fig. 5.4m below for an example on how to do this. The software will automatically effect your changes whenever you do this.
(fig. 5.4m)
b) Click on the file name to download the Excel file to your computer. The number of download will change as soon as you click on the file name. See fig. 5.4n below for an example on how to download KYC excel file.
NOTE; Only person(s) assigned right to ‘Process KYC report’ and ‘Download KYC Report’ can carry out this operation
(fig. 5.4n)
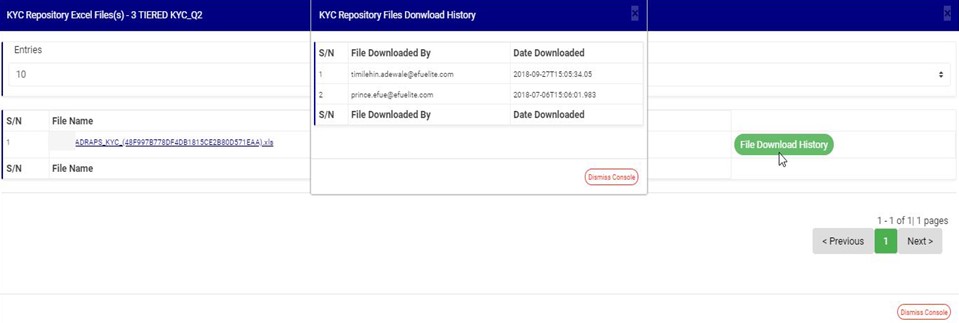
c) To see who downloaded the file and the time of download, click on the ‘File Download History’ button. A console will be displayed on screen as in fig. 5.4o below for an example. Close the console using the DISMISS button at the bottom-right corner of the console.
(fig. 5.4o)
d) Also, at the bottom-right corner of the KYC Repository Excel file(s) page, the software gives information about the number of pages of the KYC Repository Excel file(s) list,, with the page numbers written out. All the page numbers represent buttons for each page. By clicking on any page number, the software takes you to that particular page. The NEXT button will take you to the page after the one you are viewing at the moment, while the PREVIOUS button will take you to the page before the one you are viewing at that moment. To close this page, click on the DISMISS button. It is also at the bottom-right corner of the page.
➔ The numbers under the ‘XML’ column (in fig. 5.4g) also represent the number of XML files that the software has written the respective report into. By clicking on the number of XML files, a page will be displayed as in fig. 5.4p
(fig.5. 4p)
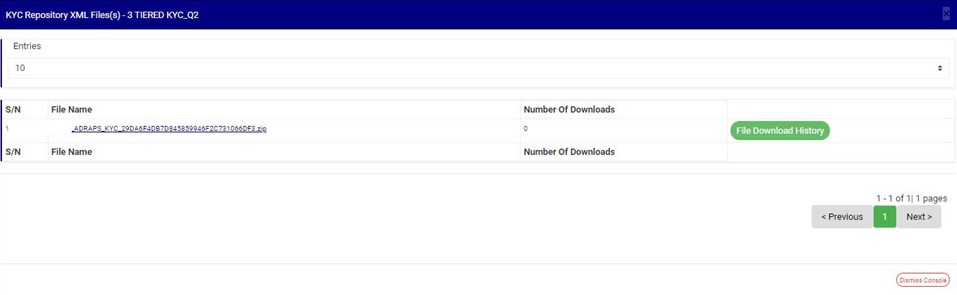
➔ The KYC Repository XML file(s) page also gives information about the XML file name(s), the number of times users have downloaded the file(s) and the download history. See the following steps on how to make use of its features. The features on the KYC Repository XML file(s) page work like those of the KYC Repository Excel file(s) page.
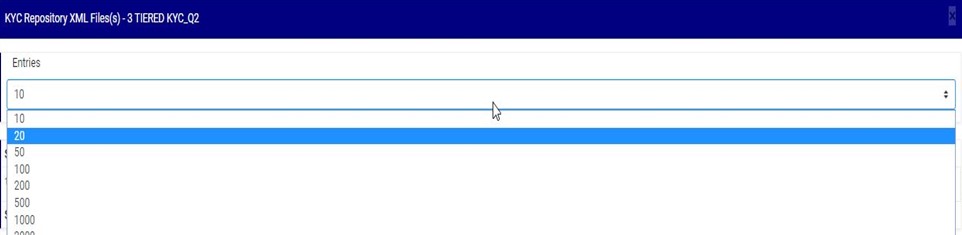
a) Click on the entries box to adjust the number of XML files you want to see per page. See fig. 5.4q below for an example on how to do this. The software will automatically effect your changes whenever you do this.
(fig. 5.4q)
b) Click on the file name to download the XML file to your computer. The number of download will change as soon as you click on the file name. The file name is underlined and the download is immediately also! See fig. 5.4r below for an example on how to download KYC XML file.
NOTE; Only person(s) assigned right to ‘Process KYC report’ and ‘Download KYC Report’ can carry out this operation.
(fig. 5.4r)
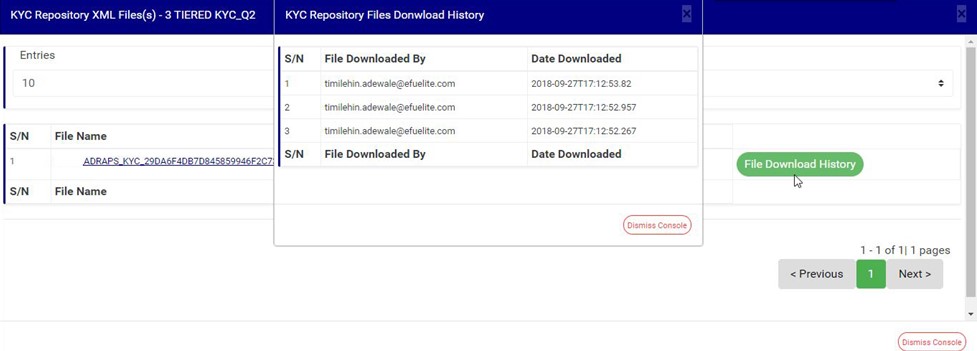
c) To see who downloaded the file and the time of download, click on the ‘File Download History’ button. A console will be displayed as in fig. 5.4s below for an example. Close the console using the DISMISS button at the bottom-right corner of the console.
(fig. 5.4s)
d) At the the bottom-right corner of the KYC Repository XML file(s) page, the software also gives information about the number of pages of the KYC Repository XML file(s) list, with the page numbers written out. All the page numbers represent buttons for each page. By clicking on any page number, the software takes you to that particular page. The NEXT button will take you to the page after the one you are viewing at the moment, while the PREVIOUS button will take you to the page before the one you are viewing at that moment. To close this page, click on the DISMISS button at the bottom-right corner of the page. See these features in fig. 5.4s above.
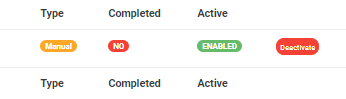
➔ Back to fig. 5.4g – KYC Repository list page, at the end of each report row, the software shows if the processing of the report is enabled or dis-enabled under the ‘ACTIVE’ column.
➔ For reports that have been completed, their status will read, ENABLED. See fig. 5.4g for an instance.
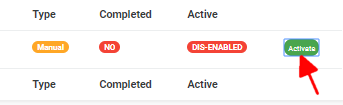
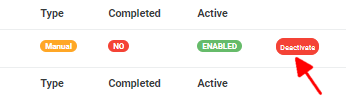
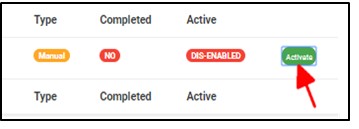
➔ For reports that have not been completed, there will be an extra button next to their ACTIVE status. This button is used to ACTIVATE or DEACTIVATE the processing of the report. See fig. 5.4g also for an example. The button turns red when the report is enabled and it can be used to DEACTIVATE the report. It is green when the report is dis-enabled and it can be used to ACTIVATE the report for processing.
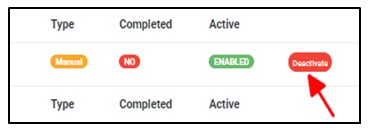
STEP 4: Click on Activate to enable processing of report or Deactivate to disable the processing of the report.
NOTE; Only person(s) assigned right to ‘Process KYC report’ and ‘Edit KYC Report’ can carry out this operation
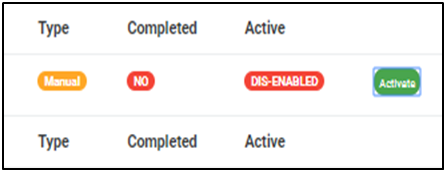
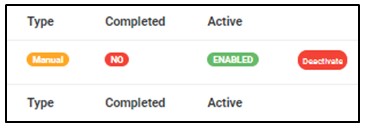
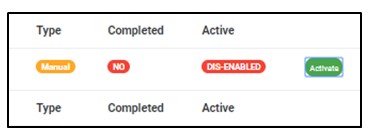
➔ Clicking on ACTIVATE turns the status bar of the report to green with an ‘ENABLED’ inscription, while clicking on DEACTIVATE will turn the status bar back to red with an ‘DIS-ENABLED’ inscription. See fig. 5.4t and fig. 5.4u to see the result of activating the report for an example and see fig. 5.4v and fig. 5.4w to see the result of deactivating the report for another example.
● Activating a report
(fig. 4.7t)
(fig. 4.7u)
● Deactivating a report
(fig. 4.7v)
(fig. 4.7w)
➔ At the bottom-right corner of the page, the software gives information about the number of pages of your result, with the page numbers written out. All the page numbers represent buttons for each page. By clicking on any page number, the software takes you to that particular page. There is the NEXT button to take you to the next page when you click on it and there is a PREVIOUS button to take you to the page before the one you are viewing at that moment. See these features in fig. 5.4x below.
Anti-Money laundering and Countering Financing of Terrorism regulations places obligations on financial institutions to detect and deter money laundering and terrorism financing. A financial institution is required to render an STR/SAR report to the Nigerian Financial Intelligence Unit within twenty-four hours and inform the CBN of same whenever it detects a known or suspected criminal violation of MLPA or a suspicious transaction related to money laundering activity or a violation of other laws & regulations.
A suspicious transaction is one for which there are reasonable grounds to suspect that the transaction whether or not made in cash is related to a money laundering offence or a terrorist activity financing offence. A suspicious activity refers to any observed behaviour or event that could indicate terrorism or terrorism-related crime.
STR/SAR OPERATIONS
Suspicions may arise from any branch of a financial institution. Upon any suspicion, there are processes that would kick-off to bring about an STR/SAR to be sent to the NFIU by the Compliance team. These processes are;
ADRAPS THREE-TIERED KNOW YOUR CUSTOMER REPORT (ADRAPS KYC)
This section provides a guide on how to perform operations pertaining to ADRAPS KYC Report on the Compliance Planet, with step-by-step instructions and pictures.
What is ADRAPS KYC REPORT?
KYC stands for ‘Know Your Customer”. The ‘Know Your Customer’ Policy is a mandatory framework for all banks and other financial institutions used for customer identification. It is the process of a business verifying the identity of its clients and assessing potential risks of illegal intentions.
However, the enforcement of this requirement excluded the socially and financially disadvantaged persons, a greater segment of the Nigerian population, from financial services because of lack of an acceptable means of identification. Therefore, to promote financial inclusion, the Central Bank of Nigeria (CBN) issued the Three-tiered KYC requirements. With this development, all bank accounts in Nigeria have been categorized into tier one, two and three with the documentations for each class clearly established by the policy.
While, the three-tiered KYC requirements seek to promote and deepen financial inclusion, the objective of the KYC process is to prevent banks from being used, intentionally or unintentionally by criminal elements for money laundering. All banks are required to file three-tiered KYC report quarterly.
ADRAPS KYC REPORT OPERATIONSThe operations pertaining to ADRAPS KYC on the Compliance Planet are;
The compliance planet allows you to manually schedule your ADRAPS KYC report ahead of time and download them when they are completely processed. Here is how to do this.
NOTE; Only person(s) assigned right to ‘Process KYC report’ can carry out this operation
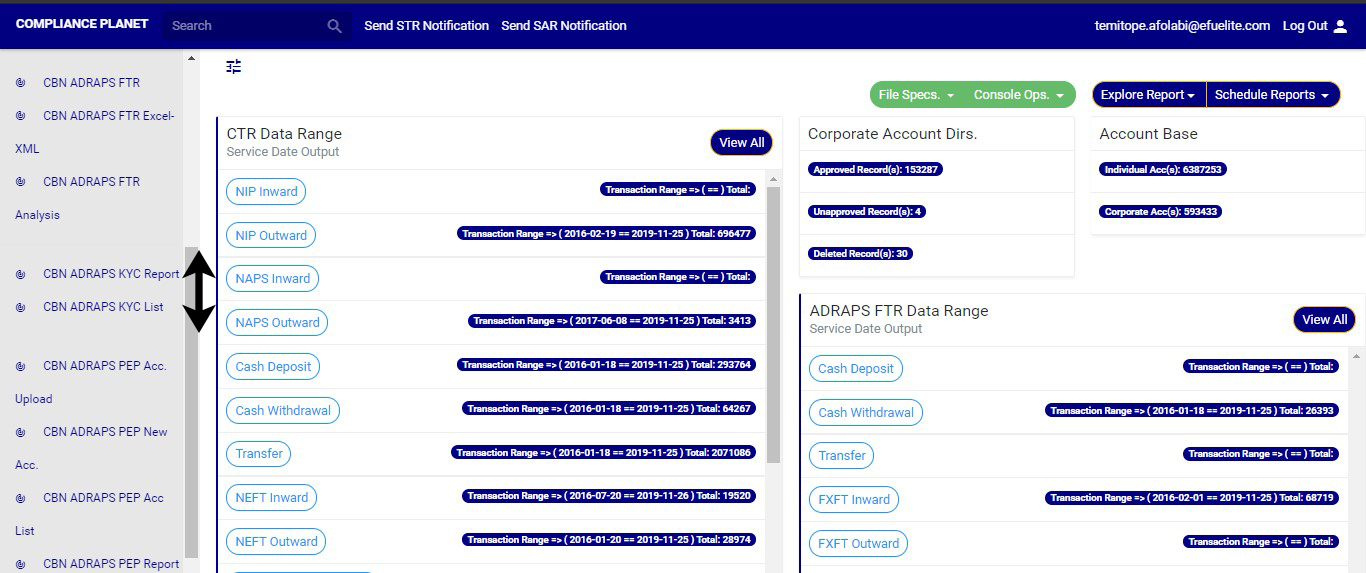
STEP 1: From the left hand side menu, click on CBN ADRAPS KYC Report. As in fig. 5.3a below.
(fig. 5.3a)
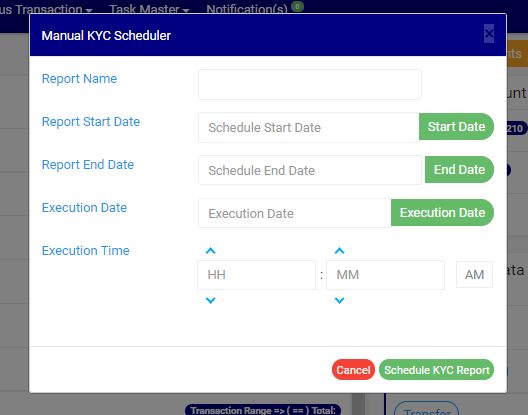
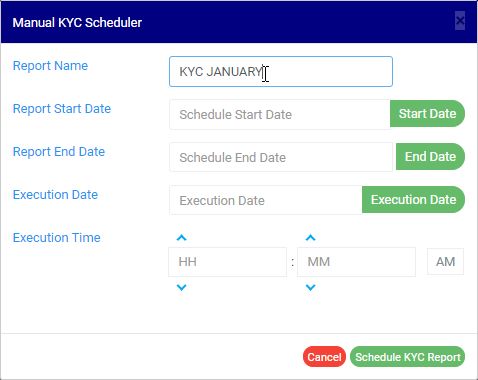
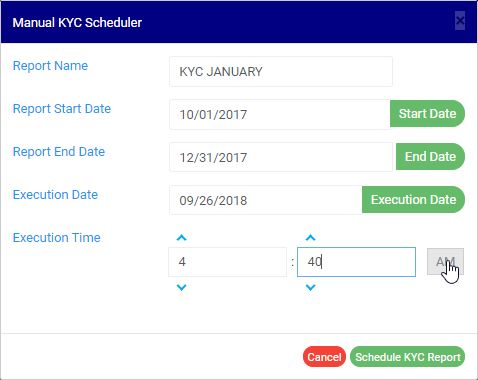
➔ By clicking on ‘CBN ADRAPS KYC REPORT’, a Manual KYC Scheduler console as in fig. 5.3b below will be displayed.
(fig. 5.3b)
STEP 2: Fill in the name of your report in the REPORT NAME box. The report name should be any title of your choice for easy identification. See fig. 5.3c for an example.
(fig. 5.3c)
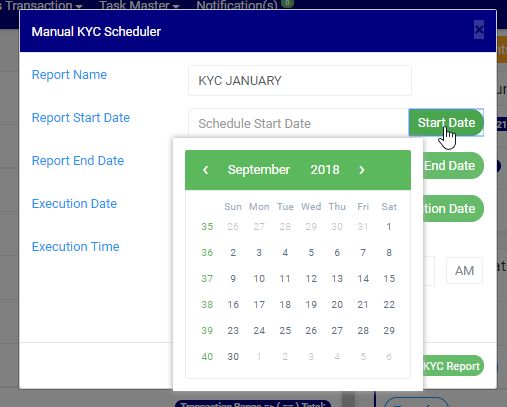
STEP 3: Click on the REPORT START DATE button to select the date that begins the period for which you want to generate an ADRAPS KYC report from a calendar as shown in fig. 5.3d.
(fig. 5.3d)
➔ Take a look at the arrows labelled a to d in fig. 5.3e to study the calendar.
a. Click on the given year to change it to your year of choice.
b. Click on the given month to change it to your month of choice.
c. Then, click on the date of the month.
d. You can also click on the angle brackets on the calendar [ ‘’ ] to go backward or forward.
(fig. 5.3e)
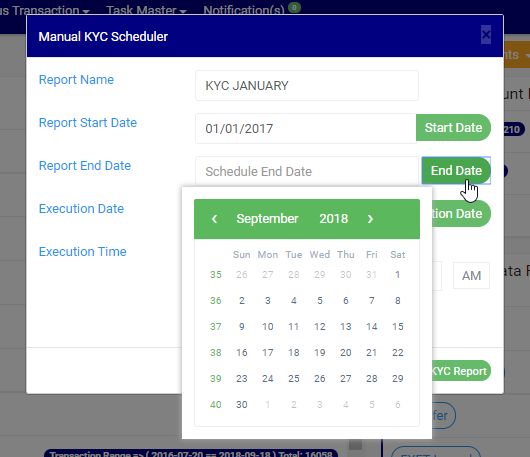
STEP 4: Click on the REPORT END DATE button to select the date ending the period for which you want to generate an ADRAPS KYC report from a calendar as shown in fig. 5.3f. The calendar works like the one in fig. 5.3e above.
(fig. 5.3f)
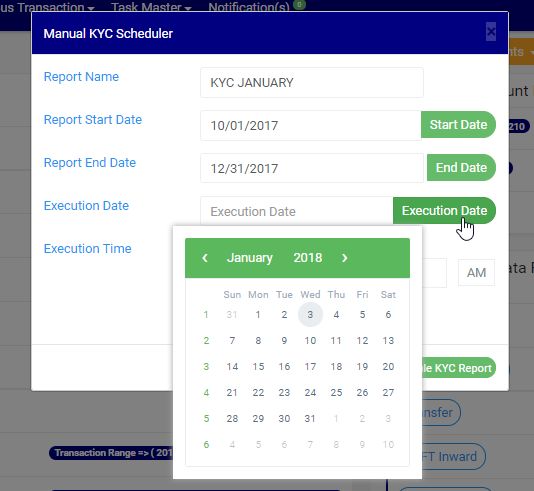
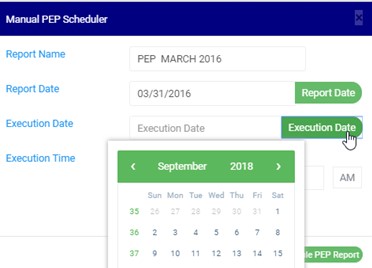
STEP 5: Click on the EXECUTION DATE button to select the date you want your ADRAPS KYC report to be processed, from a calendar as shown in fig. 5.3g. The calendar also works like the one in fig. 5.3e above.
(fig. 5.3g)
STEP 5: Set your report’s EXECUTION TIME by filling in the ‘hour’ and the ‘minute’ you want the report to be processed. There’s a button next to the hour and minute boxes used for switching between AM and PM. See an example in fig. 5.3h.
(fig. 5.3h)
STEP 6: Click on ‘SCHEDULE KYC REPORT’ to create your report or CANCEL to close the console. These buttons are at the bottom-right corner of the console. See them in fig. 5.3h above.
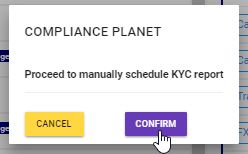
Clicking the ‘SCHEDULE KYC REPORT’ displays a confirmation console as in fig 5.3i below click on ‘CONFIRM’ to proceed with your operation to schedule the report or ‘CANCEL’ to go back to the scheduler.
The compliance planet keeps a record list of all PEP reports that have been manually scheduled. In this section, you will learn how to find your scheduled PEP report and some other features to give you the best experience.
NOTE: Only person(s) assigned right to ‘View PEP report’ can carry out this operation
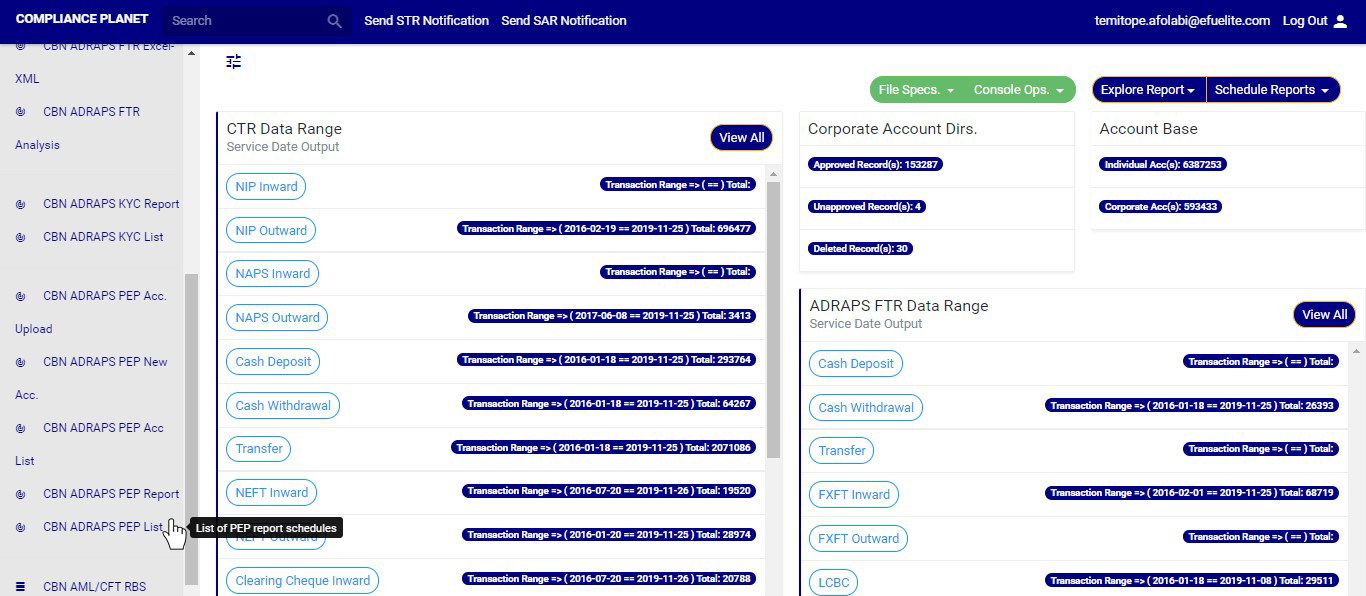
STEP 1: From the left hand side menu, click on ‘CBN ADRAPS PEP LIST’ Check out fig. 4.7a below
(fig. 4.7a)
➔ This displays a page as in fig. 4.7b below.
(fig. 4.7b)
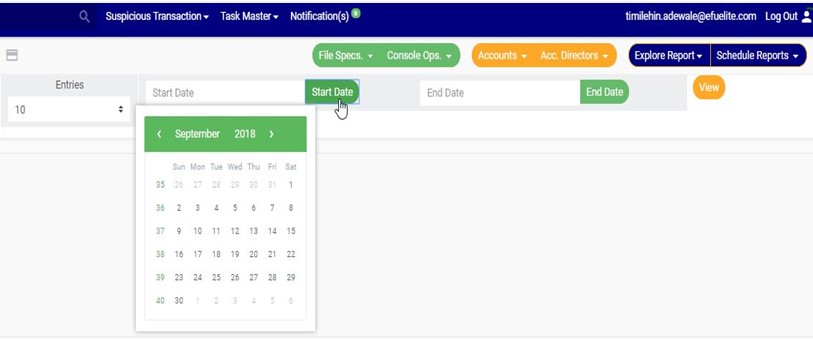
STEP 2: Click on the START DATE button/box and the END DATE button/box to set the beginning and the end of the period in which the reports you want to see have been scheduled for. See how to do this in fig. 4.7c below.
Fig. 4.7d shows a labelled calendar to guide you on how to make use of the calendar.
(fig. 4.7c)
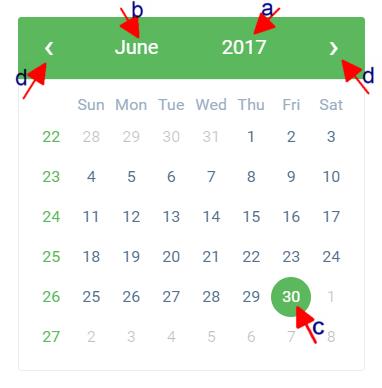
➔ Take a look at the arrows labelled a to d in fig. 4.7d to study the calendar.
a. Click on the given year to change it to your year of choice.
b. Click on the given month to change it to your month of choice.
c. Then, click on the date of the month.
d. You can also click on the angle brackets on the calendar [ ‘’ ] to go backward or forward.
(fig. 4.7d)
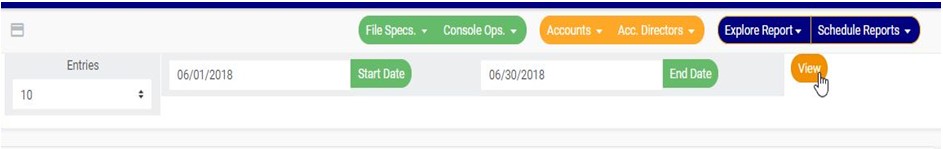
➔ For instance to see reports for June, 2018, the start and end date would be 06/01/2018 and 06/30/2018 respectively. See an example in fig. 4.7e below.
(fig. 4.7e)
➔ You can increase the number of reports you want to see per page by clicking on the ENTRIES box. Pick any number of entries per page of your choice. See fig. 4.7f below for an example.
(fig. 4.7f)
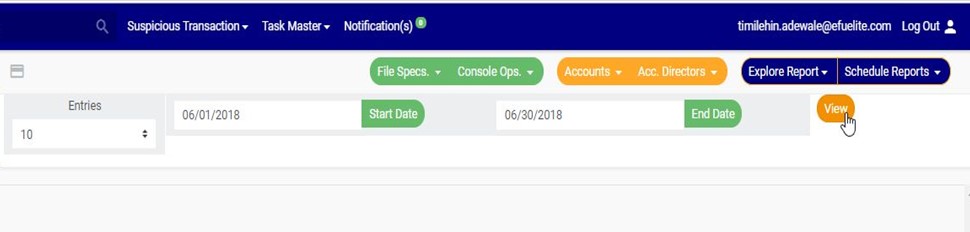
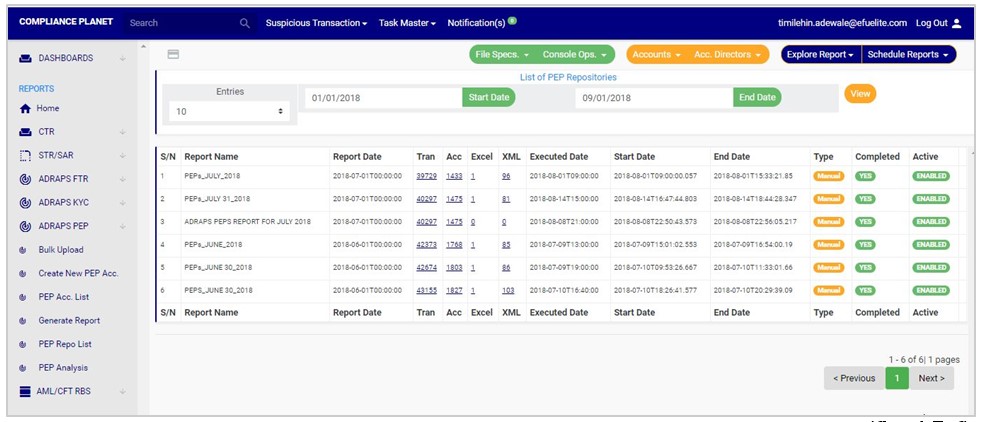
STEP 3: Click on the VIEW button to see the reports. It is an orange color button at the upper area of the page, next to the END DATE box. By doing this, the software will make a search and reports that were scheduled for that period you have entered in the date boxes will be displayed. See fig. 4.7g to see the pointer clicking on the view button and see the results of the example in fig. 4.7h.
(fig. 4.7g)
(fig. 4.7h)
➔ You can make changes to your date but to effect the changes you have made on the page, click on VIEW. For instance; when you change the date entries, click on view to see the reports for the new date range you have just set.
➔ The results of the report(s) that fall within that date range will be displayed row by row. On every row, for each report, the software will give information about the number of transactions contained in each report, the number of accounts involved, the number of Excel files and XML files the software has exported report information into, the execution date and time, the start date and end date, the type of report, and a comment on whether the processing of the report has been completed or not. See fig. 4.7h above.
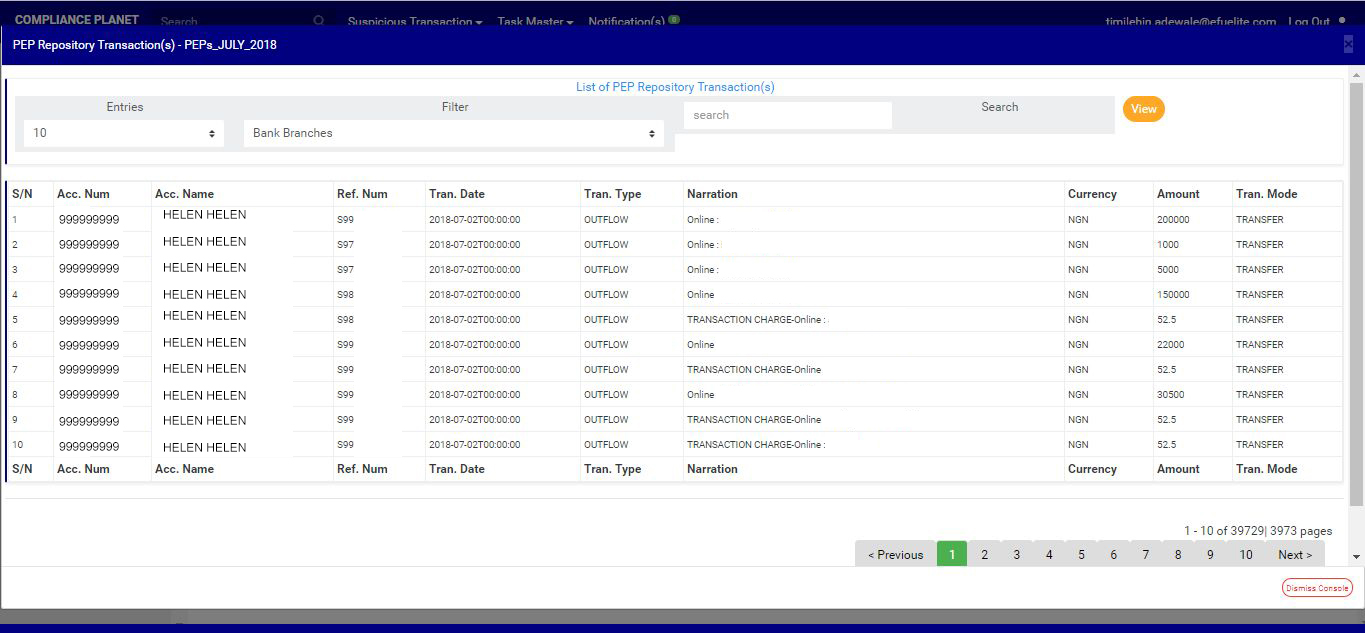
➔ The numbers under the ‘Tran’ column (in fig. 4.7h) represent the number of transactions carried out by the PEPs that are being reported in the respective reports. By clicking on the number of transactions, the software will display a page that gives a list of the transactions carried out by the PEPs in the particular report. See fig. 4.7i below for an example of a PEP repository transaction(s) page.
(fig. 4.7i)
➔ See the following steps (a – f) on how to make use of the features on the PEP Repository Transaction page.
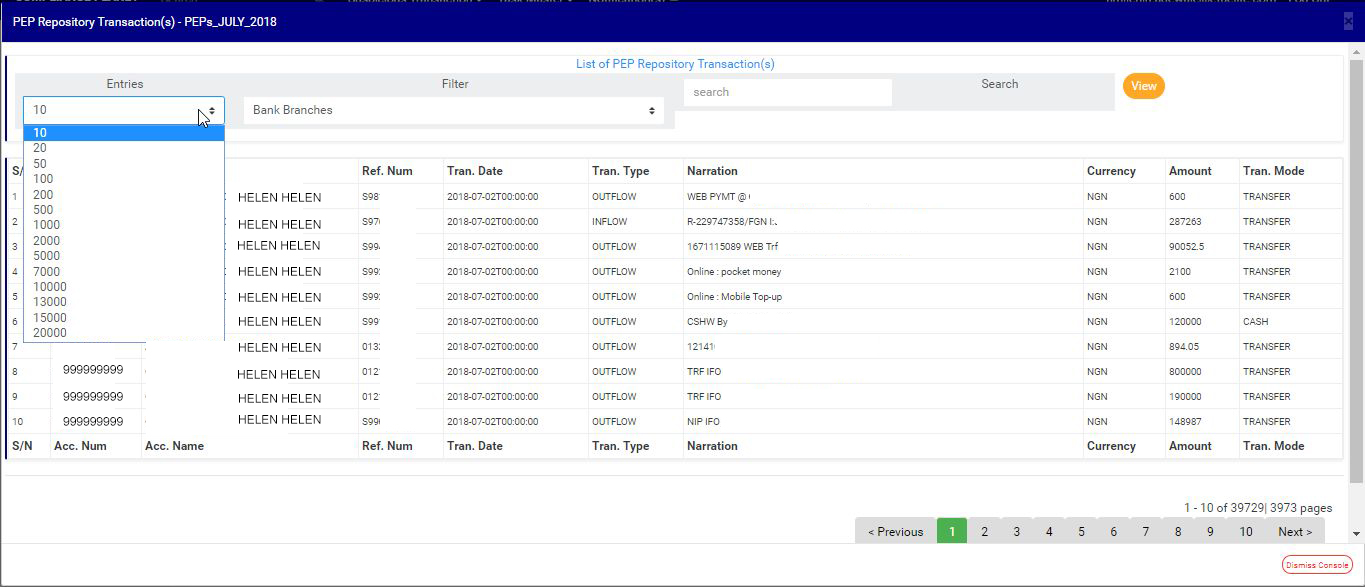
a) Click on the entries box to adjust the number of transactions you want to see per page. See fig. 4.7j below for an example on how to do this. The software will automatically effect your changes.
(fig. 4.7j)
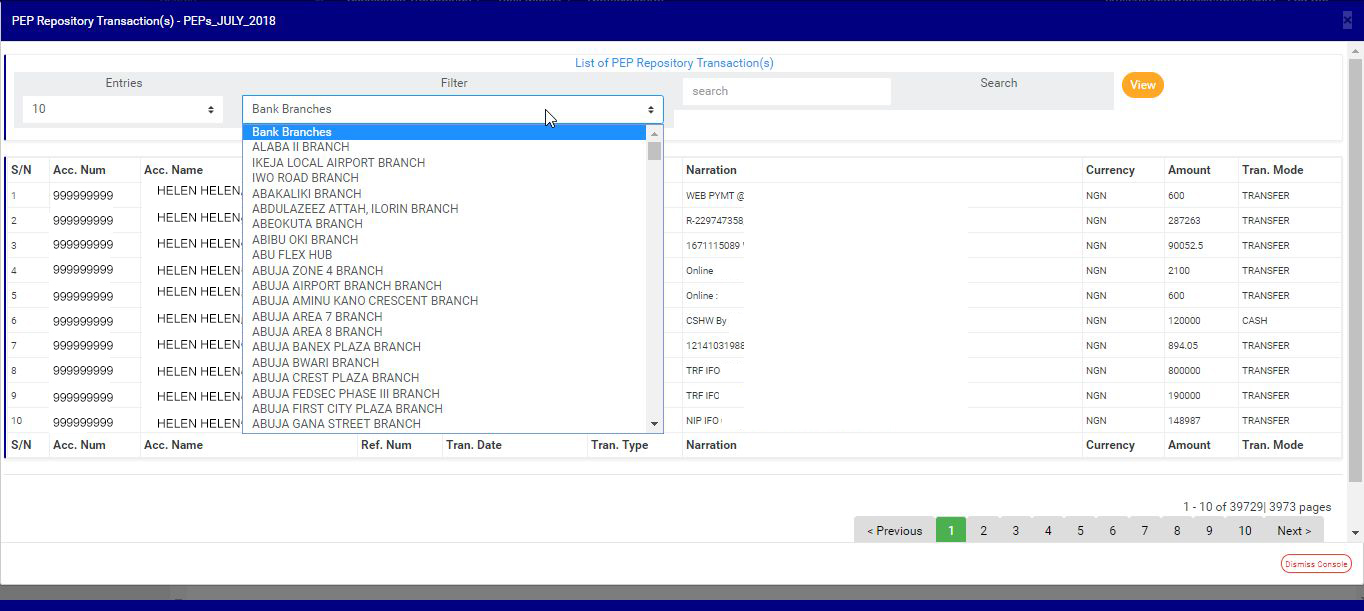
b) Click on the filter box to select a bank branch for which you want to see PEP transactions. See fig. 4.7k below for an example on how to do this.
(fig. 4.7k)
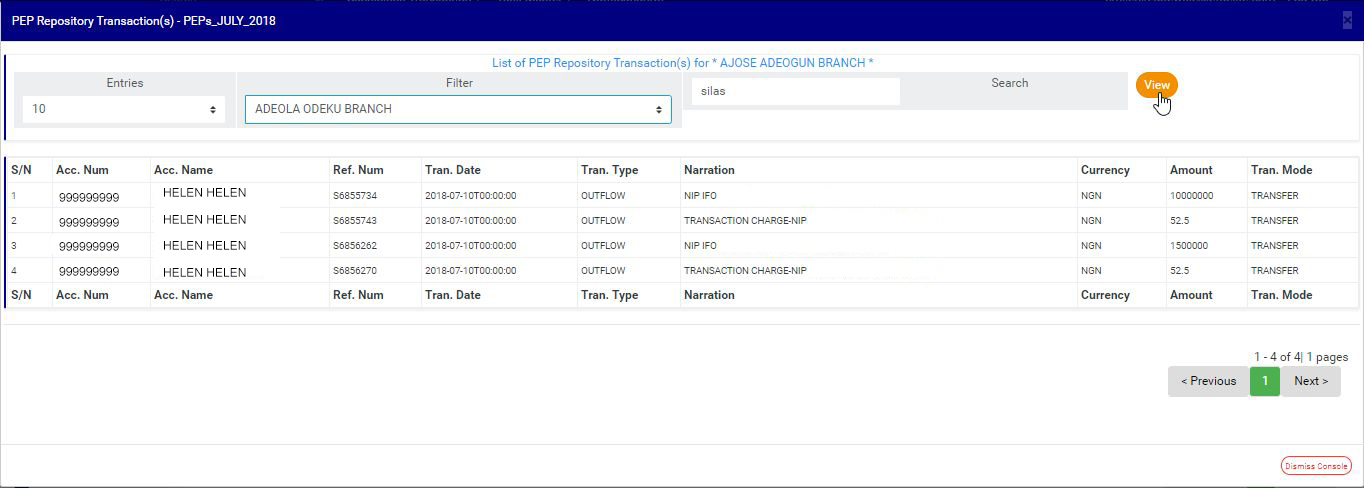
c) After selecting the bank branch of your choice as in fig. 4.7k above, click on VIEW to see the transactions attached to the selected bank branch. See fig. 4.7l for an example on how to do this.
(fig. 4.7l)
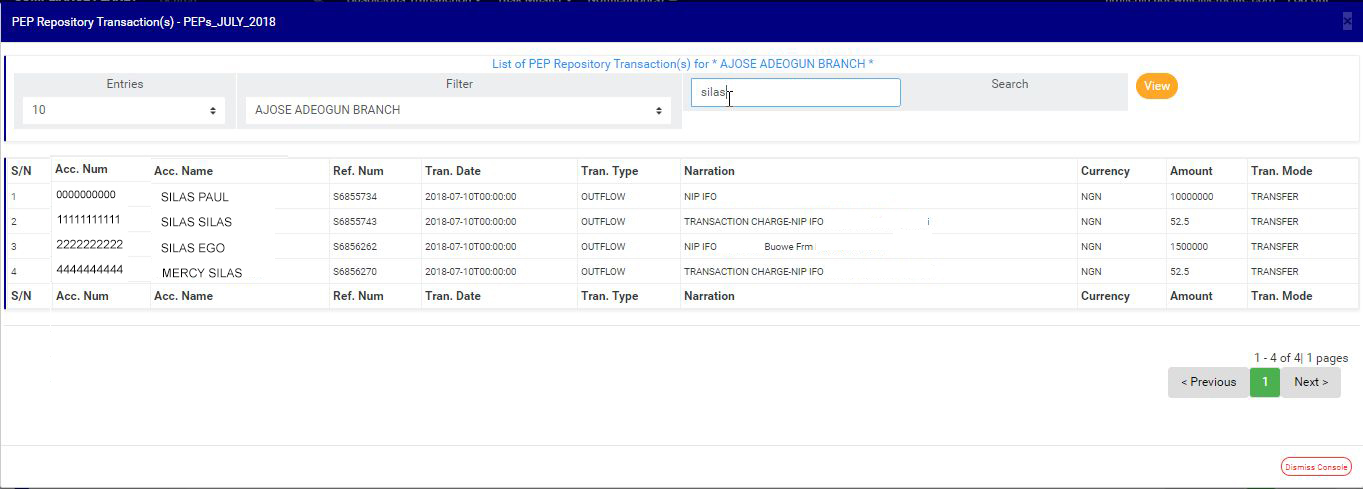
d) You can search for a particular transaction using an account number, account name, reference number, transaction type, narration, amount or transaction mode. To do this, type in the search term in the search box as in the example in fig. 4.7m below. The software will automatically search out your search term as soon as you type in a character in the search box. You do not have to click on the VIEW button for the software to carry out a search.
(fig. 4.7m)
e) At the end of the page, the bottom-right corner, the software gives information about the number of pages of your result, with the page numbers written out. All the page numbers represent buttons for each page. By clicking on any page number, the software takes you to that particular page. There is the NEXT button to take you to the next page when you click on it and there is a PREVIOUS button to take you to the page before the one you are viewing at that moment. See these features in fig. 4.7i, fig. 4.7j, fig. 4.7k, fig. 4.7l and fig. 4.7m
f) To close this page, click on the DISMISS button at the bottom-right corner of the page. Check out fig. 4.7i, fig. 4.7j, fig. 4.7k, fig. 4.7l and fig. 4.7m above to see this button.
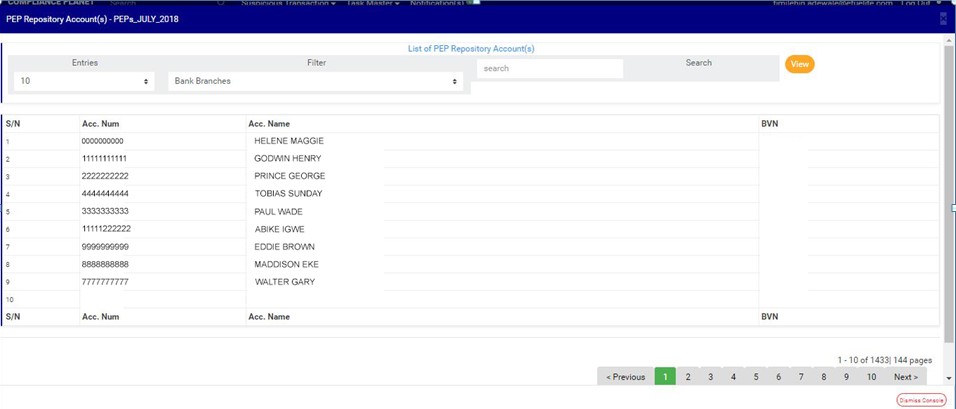
➔ The numbers under the ‘Acc’ column (in fig. 4.7h) represent the number of PEP accounts being reported in each report. By clicking on the number of accounts, the displays a page showing list of the PEP accounts and their respective details. See fig. 4.7n below to see an example of the PEP repository account(s) page.
(fig. 4.7n)
➔ See the following steps (a – f) on how to make use of the features on the PEP Repository Account(s) page.
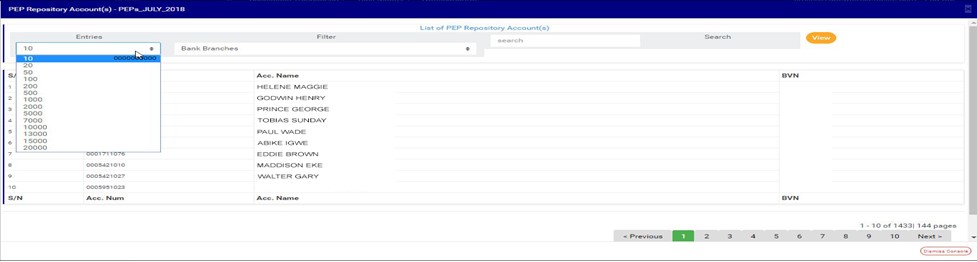
a) Click on the entries box to adjust the number of accounts you want to see per page. See fig. 4.7o below for an example on how to do this. The software will automatically effect your changes whenever you do this.
(fig. 4.7o)
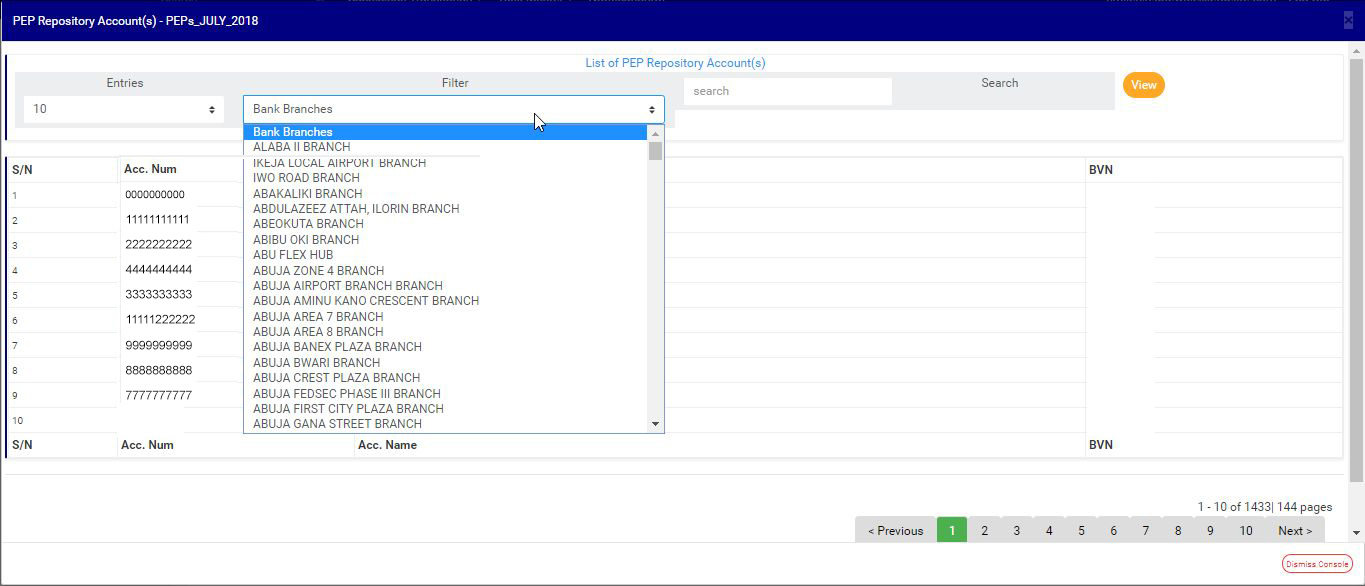
b) Click on the filter box to select a bank branch for which you want to see PEP accounts. See fig. 4.7p below for an example on how to do this.
(fig. 4.7p)
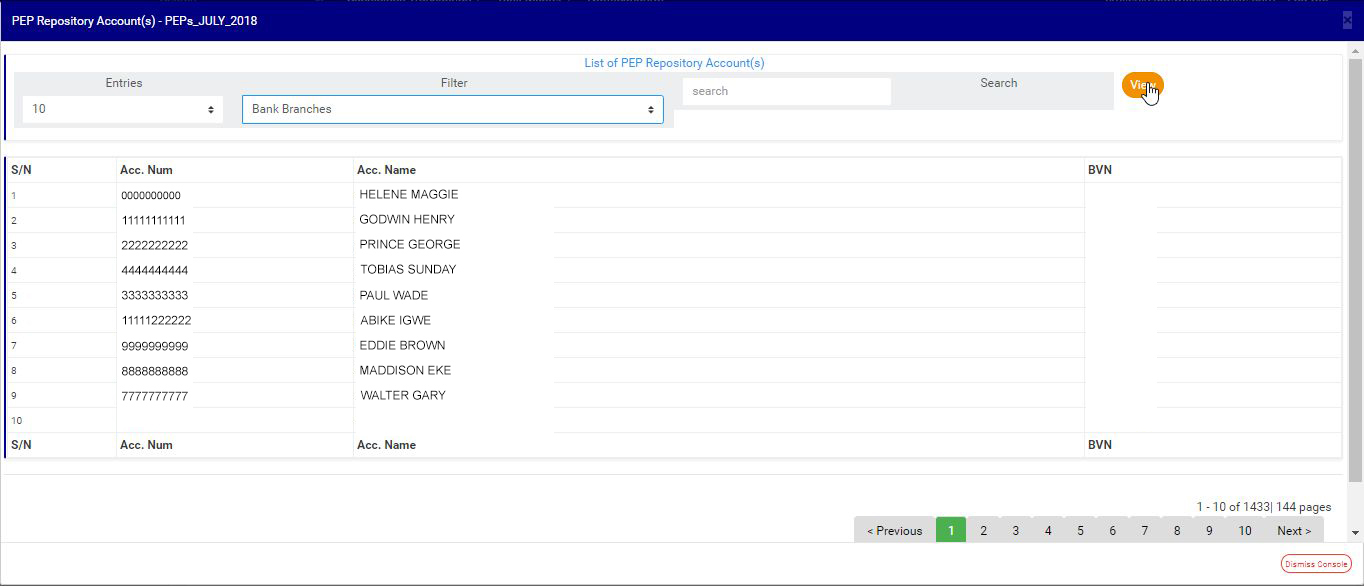
c) After selecting the bank branch of your choice as in fig. 4.7p above, click on VIEW to see the accounts attached to the selected bank branch. See fig. 4.7q for an example on how to do this.
(fig. 4.7q)
d) You can search for a particular account using the account number, account name or BVN. To do this, type in the search term in the search box as in the example in fig. 4.7r below. The software will automatically search out your search term as soon as you type in a character in the search box. You do not have to click on the VIEW button for the software to carry out a search.
(fig. 4.7r)
e) At the end of the page, the bottom-right corner, the software gives information about the number of pages of your result, with the page numbers written out. All the page numbers represent buttons for each page. By clicking on any page number, the software takes you to that particular page. There is the NEXT button to take you to the next page when you click on it and there is a PREVIOUS button to take you to the page before the one you are viewing at that moment. See these features in fig. 4.7n, fig. 4.7o, fig. 4.7p, fig. 4.7q and fig. 4.7r
f) To close this page, click on the DISMISS button at the bottom-right corner of the page. Check out fig. 4.7n, fig. 4.7o, fig. 4.7p, fig. 4.7q and fig. 4.7r above to see this button.
➔ The numbers under the ‘Excel’ column (in fig. 4.7h) also represent the number of Excel files that the software has written the report into. By clicking on the number of Excel files, a page will be displayed on the screen. See fig. 4.7s below for an example of the page..
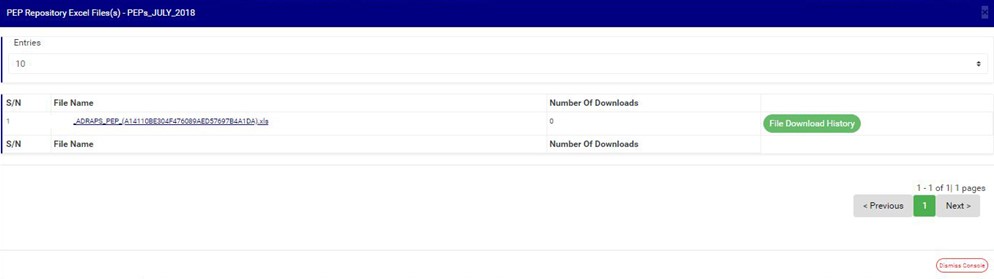
(fig. 4.7s)
➔ The PEP Repository Excel file(s) page gives information about the Excel file name(s), the number of times users have downloaded the file and the download history. See the following steps (a -d) on how to make use of its features.
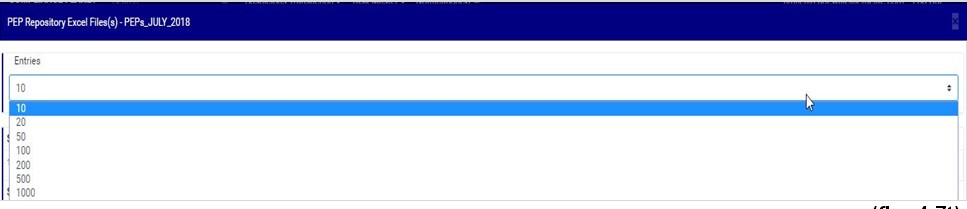
a) Click on the entries box to adjust the number of Excel files you want to see per page. See fig. 4.7t below for an example on how to do this. The software will automatically effect your changes whenever you do this.
(fig. 4.7t)
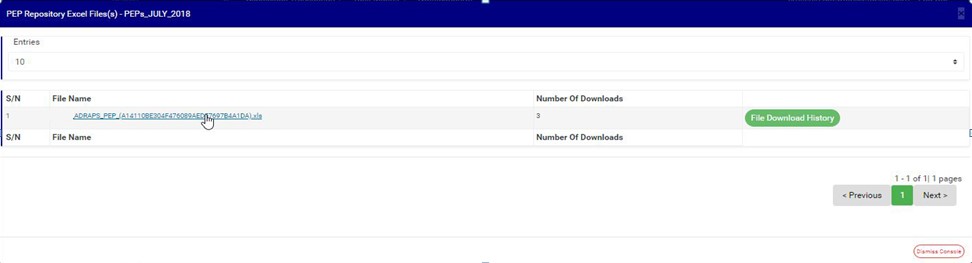
b) Click on the file name to download the Excel file to your computer. The file name is underlined and the download happens immediately! The number of download changes as soon as you click on the file name. Compliance software is fast and easy! See fig. 4.7u below for an example on how to download PEP excel file.
NOTE; Only person(s) assigned right to ‘View PEP report’ and ‘Download PEP report’ can carry out this operation
(fig. 4.7u)
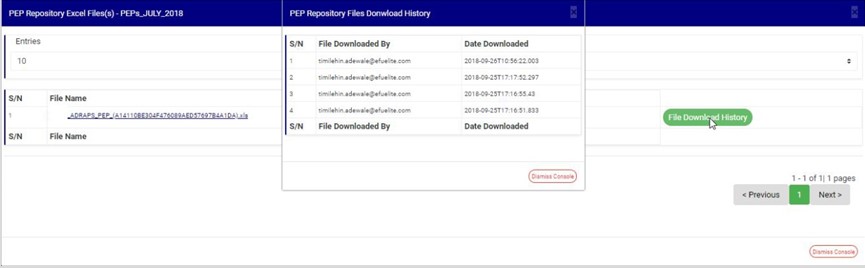
c) To see who downloaded the file and the time of download, click on the ‘File Download History’ button. A small console will be displayed on the page as in fig. 4.7v below for an example. Close the console using the DISMISS button at the bottom-right corner of the console.
(fig. 4.7v)
d) Also, at the the bottom-right corner of the PEP Repository Excel file(s) page, the software gives information about the number of pages of the PEP Repository Excel file(s) list,, with the page numbers written out. All the page numbers represent buttons for each page. By clicking on any page number, the software takes you to that particular page. The NEXT button will take you to the page after the one you are viewing at the moment, while the PREVIOUS button will take you to the page before the one you are viewing at that moment. To close this page, click on the DISMISS button. It is also at the bottom-right corner of the page.
➔ The numbers under the ‘XML’ column (in fig. 4.7h) also represent the number of XML files that the software has written the respective report into. By clicking on the number of XML files, a page will be displayed on the screen. See fig. 4.7w below for an example of the page.
(fig. 4.7w)
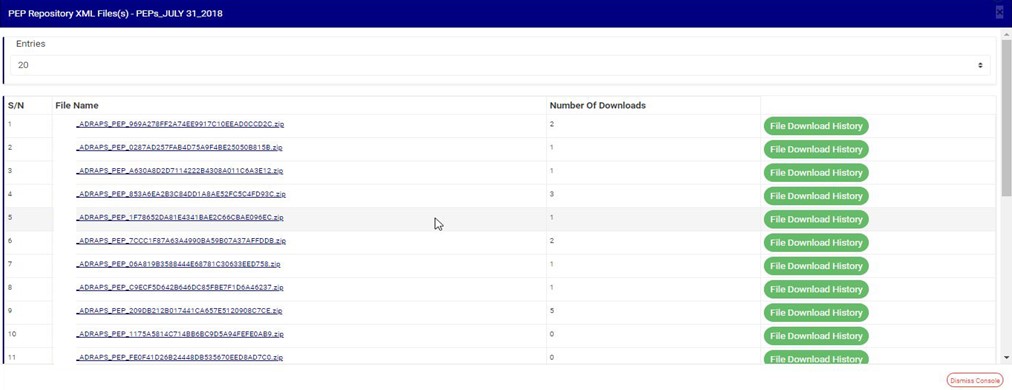
➔ The PEP Repository XML file(s) page also gives information about the XML file name(s), the number of times users have downloaded the file(s) and the download history. There are 500 PEP transactions per XML file. See the following steps (a – d) on how to make use of its features. The features on the PEP Repository XML file(s) page work like those of the PEP Repository Excel file(s) page.
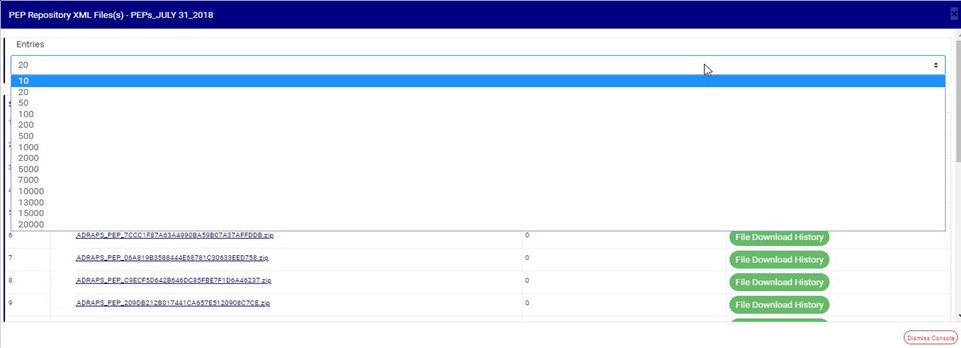
a) Click on the entries box to adjust the number of XML files you want to see per page. See fig. 4.7x below for an example on how to do this. The software will automatically effect your changes whenever you do this.
(fig. 4.7x)
b) Click on the file name to download the XML file to your computer. The number of download changes as soon as you click on the file name. The file name is underlined and the download is immediately also! See fig. 4.7u below for an example on how to download PEP XML file.
NOTE; Only person(s) assigned right to ‘View PEP report’ and ‘Download PEP report’ can carry out this operation
(fig. 4.7y)
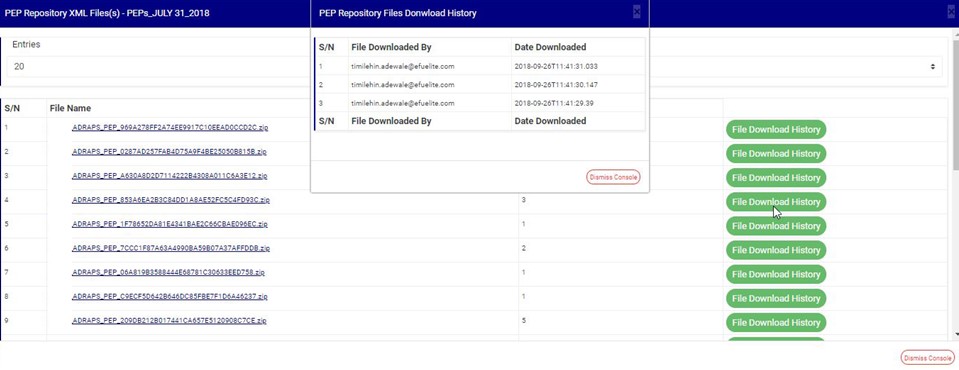
c) To see who downloaded the file and the time of download, click on the ‘File Download History’ button. A small console will be displayed on the page as in fig. 4.7v below for an example. Close the console using the DISMISS button at the bottom-right corner of the console.
(fig. 4.7z)
d) Here also, at the the bottom-right corner of the PEP Repository XML file(s) page, the software gives information about the number of pages of the PEP Repository XML file(s) list,, with the page numbers written out. All the page numbers represent buttons for each page. By clicking on any page number, the software takes you to that particular page. The NEXT button will take you to the page after the one you are viewing at the moment, while the PREVIOUS button will take you to the page before the one you are viewing at that moment. To close this page, click on the DISMISS button at the bottom-right corner of the page.
➔ Back to fig. 4.7h – Pep Repository list page, at the end of each report row, the software shows if the processing of the report is enabled or dis-enabled under the ‘ACTIVE’ column.
➔ For reports that have been completed, their status will read, ENABLED. See fig. 4.7h for an instance.
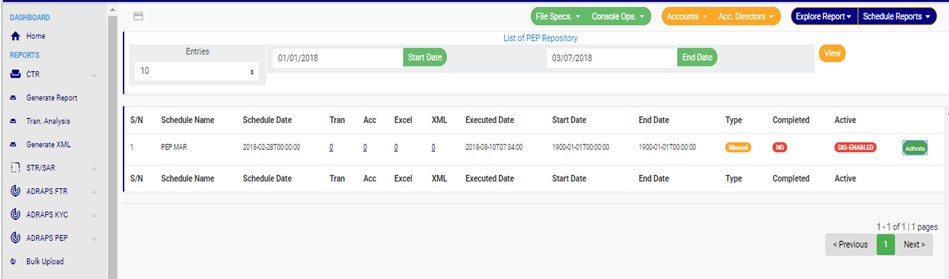
➔ For reports that have not been completed, there will be an extra button next to their ACTIVE status. This button is used to ACTIVATE or DEACTIVATE the processing of the report. See fig. 4.7aa below for an example. The button turns red when the report is enabled and it can be used to DEACTIVATE the report. It is green when the report is dis-enabled and it can be used to ACTIVATE the report for processing.
NOTE; Only person(s) assigned right to ‘View PEP report’ and ‘Edit PEP report’ can carry out this operation
(fig. 4.7aa)
➔ As in fig. 4.7aa above, the report has not been completed. Click on Activate to enable processing of report or Deactivate to disable the report.
➔ Clicking on ACTIVATE turns the status bar of the report to green with an ‘ENABLED’ inscription, while clicking on DEACTIVATE will turn the status bar back to red with an ‘DIS-ENABLED’ inscription. See fig. 4.7ab and fig. 4.7ac to see the result of activating the report for an example and see fig. 4.7ad and fig. 4.7ae to see the result of deactivating the report for another example.
●Activating a report
(fig. 4.7ab)
(fig. 4.7ac)
●Deactivating a report
(fig. 4.7ad)
(fig. 4.7ae)
➔ At the end of the page, the software gives information about the number of pages of your result, with the page numbers written out. All the page numbers represent buttons for each page. By clicking on any page number, the software takes you to that particular page. There is the NEXT button to take you to the next page when you click on it and there is a PREVIOUS button to take you to the page before the one you are viewing at that moment. See these features in fig. 4.7af below.
The compliance planet allows you to schedule your ADRAPS PEP report ahead of time. You can manually schedule and download ADRAPS PEP reports. Here is how to do this.
NOTE; Only person(s) assigned right to ‘Process PEP Report’ can carry out these operations
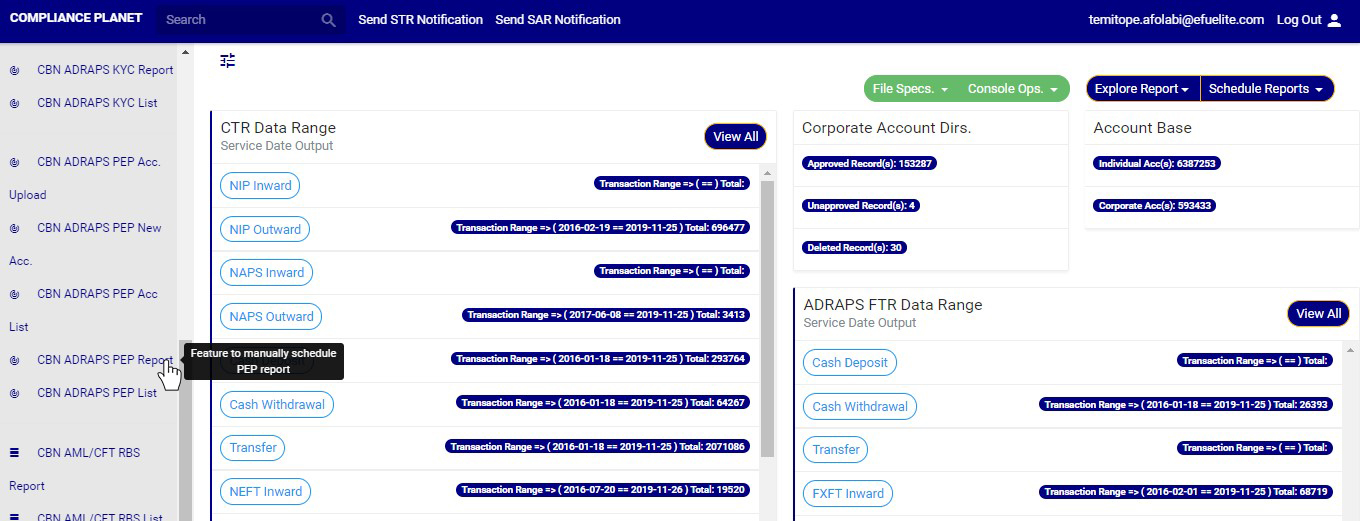
STEP 1: From the left hand side menu, click on ‘CBN ADRAPS PEP REPORT’ Check out fig. 4.6a below
(fig. 4.6a)
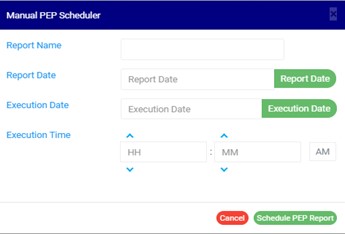
➔ By clicking on ‘CBN ADRAPS PEP REPORT’, an ADRAPS PEP Scheduler as in fig. 4.6b below will be displayed.
(fig. 4.6b)
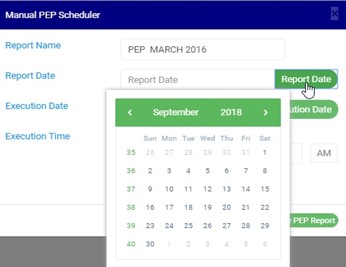
STEP 2: Fill in the name of your report in the REPORT NAME box. The report name should be any title of your choice for easy identification. (See fig. 4.6c for an example.)
STEP 3: Click on the REPORT DATE button to select the date for which you want to generate an ADRAPS PEP report from a calendar as shown in fig. 4.6c below.
(fig. 4.6c)
➔ Take a look at the arrows labelled a to d in fig.4.6d to study the calendar.
a. Click on the given year to change it to your year of choice.
b. Click on the given month to change it to your month of choice.
c. Then, click on the date of the month.
d. You can also click on the angle brackets on the calendar [ ‘’ ] to go backward or forward.
(fig. 4.6d)
STEP 4: Click on the EXECUTION DATE button to select the date you want your ADRAPS PEP report to be processed from as shown in fig. 4.6e below. The calendar works like the one in fig. 4.6d above.
(fig. 4.6e)
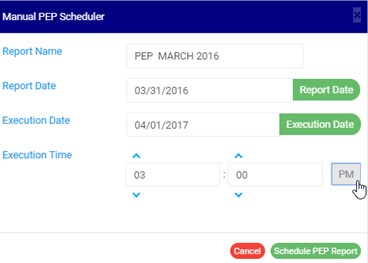
STEP 5: Set your report’s EXECUTION TIME by filling in the ‘hour’ and the ‘minute’ you want the report to be processed. There’s a button next to the hour and minute boxes used for switching between AM and PM. See an example in fig. 4.6f below.
(fig. 4.6f)
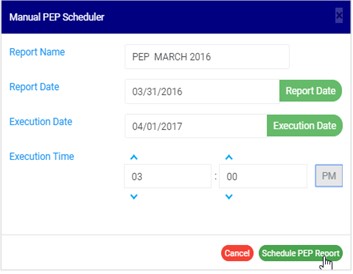
STEP 6: Click on ‘SCHEDULE PEP REPORT’ to create your report or CANCEL to close the console. These buttons are at the bottom-right corner of the console. See them in fig. 4.6f above.
(fig. 4.6g)
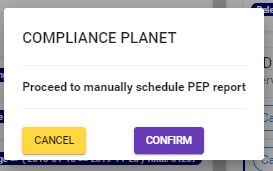
➔ This displays a confirmation console.
Click CONFIRM to confirm your request to schedule the report or CANCEL to go back to the scheduler. See fig. 4.6h below for an example of the confirmation console
Using the PEP Acc. List feature, you can see a list of all the PEP accounts on the Compliance planet. Here is how to do this.
NOTE; Only person(s) assigned right to ‘View PEP report’ can carry out this operation
STEP 1: From the left hand side menu, click on CBN ADRAPS PEP Acc List. Check out fig. 4.5a below
(fig. 4.5a)
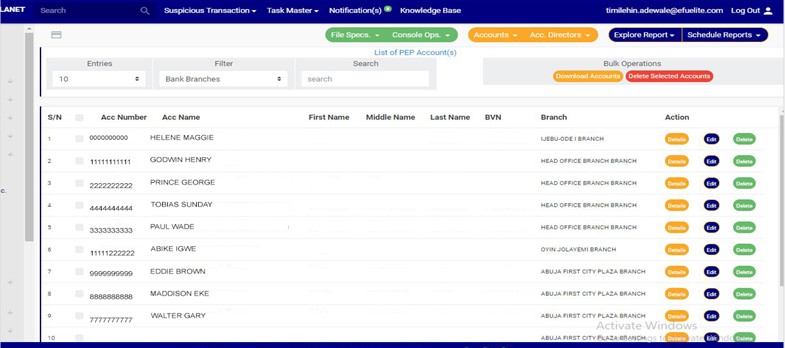
➔ By clicking on ‘CBN ADRAPS PEP Acc List’, a page as in fig. 4.5b below will be displayed. This page will automatically give you a list of all the PEP accounts saved on the Compliance planet.
(fig. 4.5b)
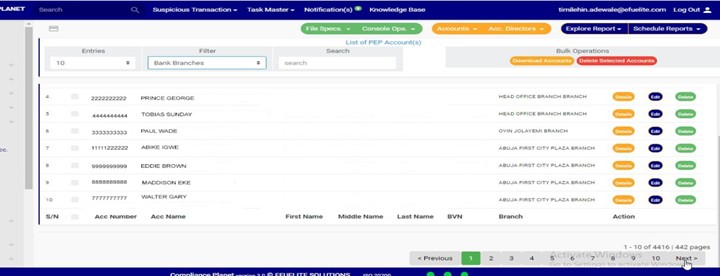
➔ When you scroll down the page ; at the bottom-right corner of the page, there is an information about the number of pages of the list and the page number of the page you are viewing at that moment as in fig. 4.5c below. The NEXT button takes you to the next page of the list if the list spreads to more than one page and the PREVIOUS button takes you to the previous page of the list that you viewed. The numbers are buttons that represent the different page numbers of the list. Click on any number to go to the page. For instance, if you click on ‘4’, the software will bring up page 4 of the list.
(fig. 4.5c)
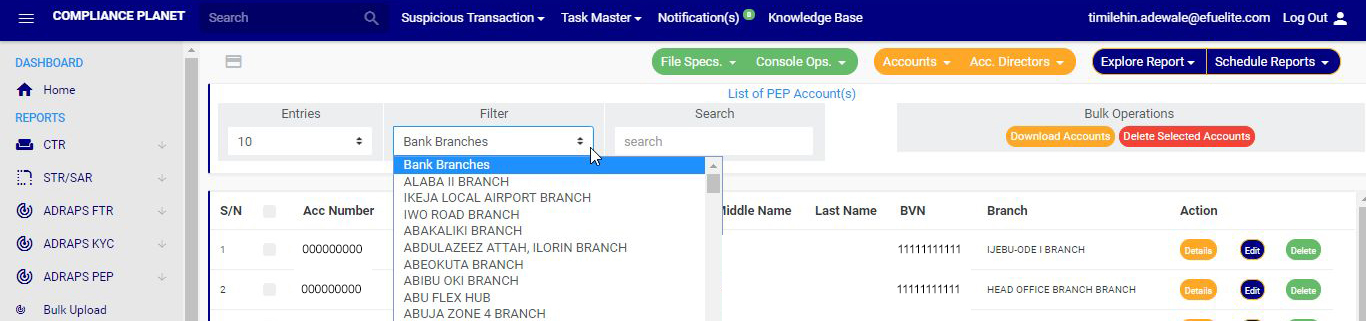
STEP 2: Click on the FILTER box to limit your account list to any bank branch. The default list is for all the branches of the institution (See fig. 4.5b and 4.5c above). So, you can select any branch to see its PEP accounts as in fig. 4.5d below.
(fig. 4.5d)
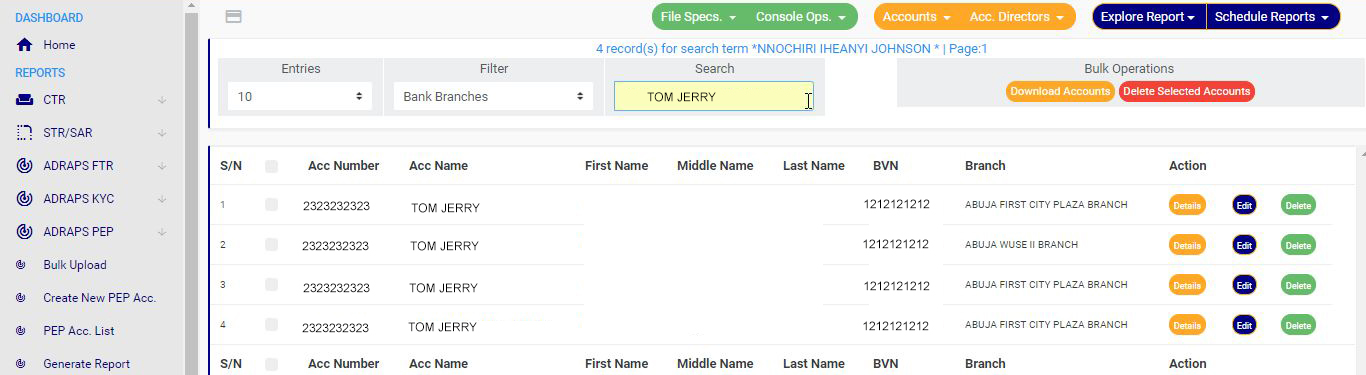
STEP 3: Type in the SEARCH box next to the FILTER box to narrow your list to a particular account number, account name, first name, middle name, last name or bank verification number. When Searching for a bank branch through the search box will not work. The filter box does that already. See fig. 4.5e below to see example of a search.
(fig. 4.5e)
➔ For every search result given on the ‘PEP Acc. List’ page, there are three (3) action buttons right at the end of the row. These buttons deal with the account on their rows only. They are; the Details button, Edit button and the Delete button.
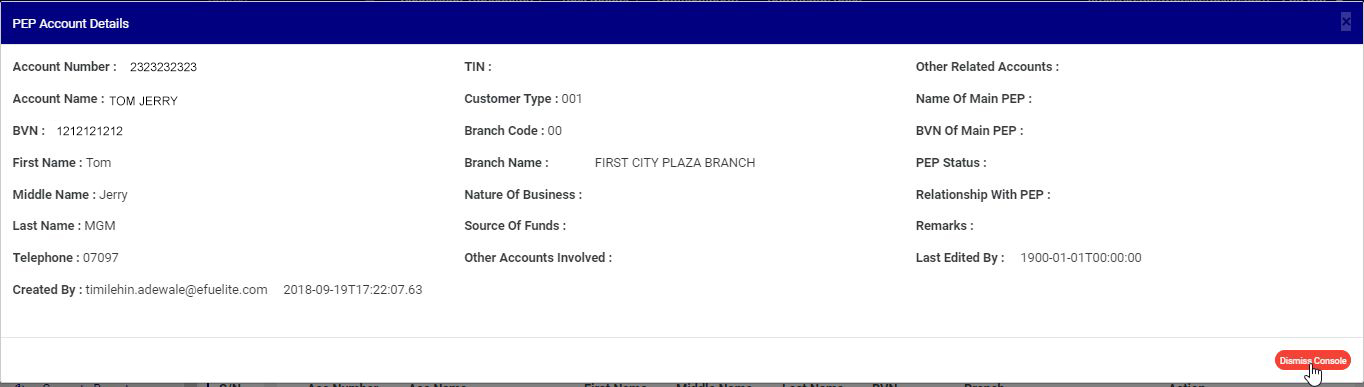
➔ By clicking on the Details button, a console as in fig. 4.5f below will be displayed on your screen showing you the details of the PEP account on the row you clicked the button. Click on DISMISS CONSOLE to close the console.
(fig. 4.5f)
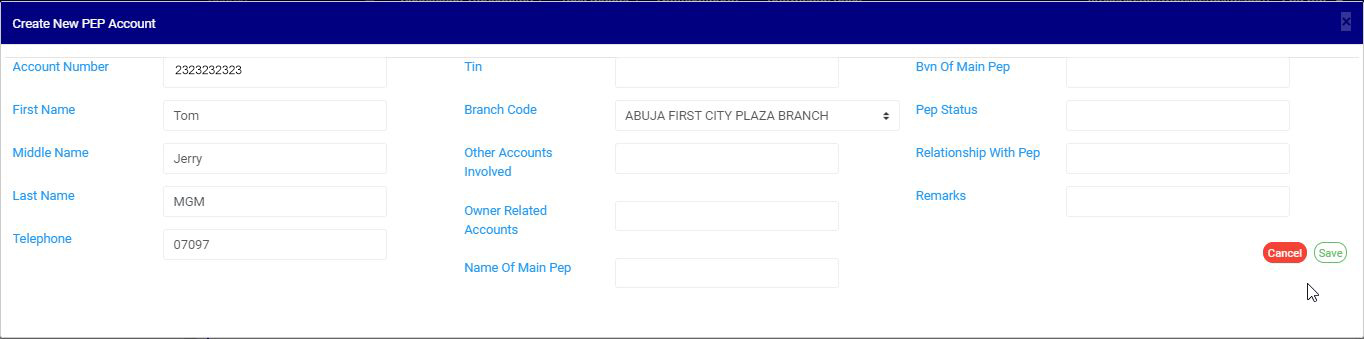
➔ If you want to update or change some information in the details you saw in the PEP account console, click on the Edit. This button is next to the DETAILS button. By clicking on EDIT, a console as in fig. 4.5g below, titled CREATE NEW PEP ACCOUNT will be displayed on your screen. This console is the same as the one generated when creating a new PEP account but it comes with fields that are already filled. After filling in the details, effect the changes by clicking on the SAVE button. If you do not want to edit the information on the console, click on CANCEL.
NOTE; Only person(s) assigned right to ‘View PEP report’ and ‘Edit PEP report’ can carry out this operation
(fig. 4.5g)
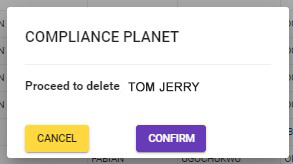
➔ To remove a PEP account , click on the DELETE button.
➔ This displays a confirmation console as in fig. 4.5h below will be displayed. Click on CANCEL if you do not want to delete the account or click on PROCEED to confirm your request to delete the account. When you do this, the account will be removed straight away from the list.
NOTE; Only person(s) assigned right to ‘View PEP report’ and ‘Edit PEP report’ can carry out this operation
(fig. 4.5h)
➔ Also, the PEP ACC. LIST page gives options for bulk operations. The bulk operations include; downloading PEP accounts and Deleting PEP accounts. Red arrows in the fig. 4.5i below indicate the buttons.
(fig. 4.5i)
➔ To carry out bulk download of PEP accounts or bulk delete of accounts, select the accounts you want to download or delete as in fig. 4.5i above and click on either the DOWNLOAD ACCOUNTS button or DELETE SELECTED ACCOUNTS button.
NOTE; You need to be assigned right to ‘Edit PEP report’ to carry out delete operation while you need to be assigned ‘right to download’ to carry out download Operation.
This feature is used for creation of single PEP account. Here are the steps to creating a new PEP account.
NOTE: Only person(s) assigned right to ‘process PEP Report’ can carry out these operation(s)
STEP 1: From the left hand side menu, click on CBN ADRAPS PEP New Acc. as in fig. 4.4a .
(fig. 4.4a)
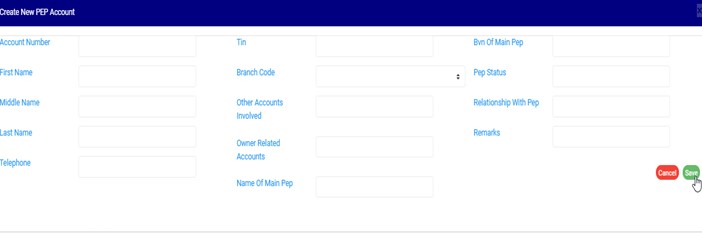
This displays a ‘CREATE NEW PEP ACCOUNT’ console as in fig 4.4b below.
(fig. 4.4b)
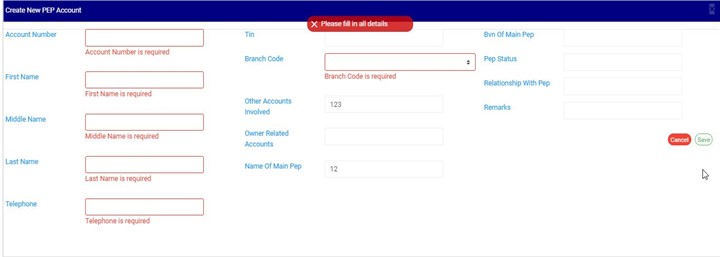
STEP 2: Enter details of the new PEP account you want to create. Some fields are mandatory to successfully create a PEP account. They are;
● Account Number – ensure the account number exists on the Compliance planet’s account base.
● First Name
● Middle Name
● Last Name
● Telephone
● Branch Code
See fig 4.4c below for an example.
(fig. 4.4c)
STEP 3: Fill in the required details and Click on SAVE to create the PEP account
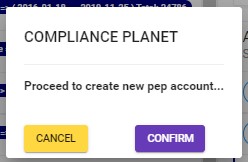
➔ Clicking on SAVE, displays a confirmation console as in fig. 4.4d below
➔ During the upload and single entry of PEP accounts, the software automatically scans other accounts related to the record entered using the CUST ID as identifier and also auto migrate these records into software.
(fig. 4.4d)
➔ Click on cancel to go back to the console.
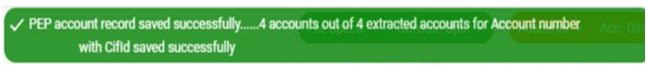
➔ Click on proceed to confirm your request to create new PEP account. A notification will be displayed as in fig. 4.4e below.
This operation involves creating multiple PEP accounts by uploading an excel file containing the details of the PEP accounts. There is another feature that handles the creation of a single PEP account. For instance; to upload fifty (50) new PEP accounts on the compliance planet, the Bulk Upload is the feature you should use instead of entering them one by one.
Compliance Planet also auto – scan the institution system for registered PEPs and notify the Compliance Team.
Here is how to upload bulk PEP information.
NOTE; Only person(s) assigned right to process PEP report can carry out this operation
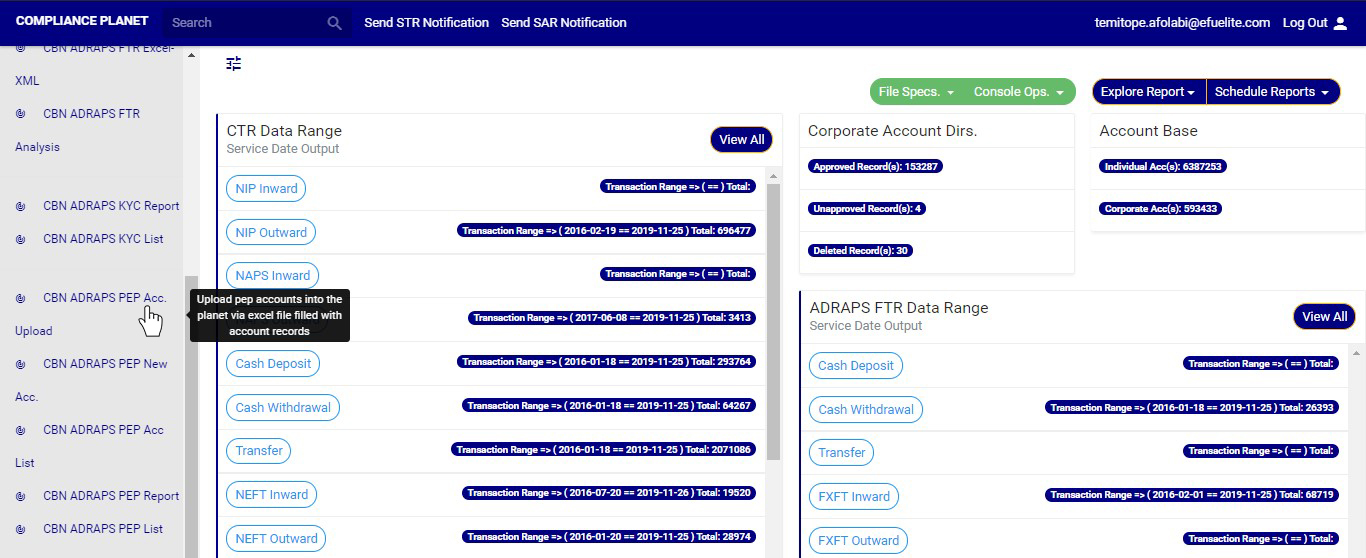
STEP 1: From the left hand side menu, click on CBN ADRAPS PEP Acc Upload. as in fig. 4.3a
(fig. 4.3a)
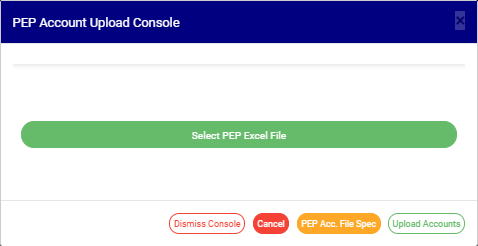
➔ This displays a ‘PEP Acc Upload’ console as in fig. 4.3b below.
(fig. 4.3b)
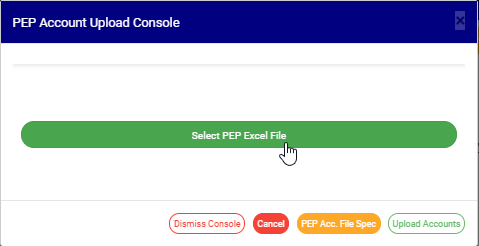
STEP 2: Click on Select PEP Excel to upload the Excel file containing the details of the PEP Accounts you want to save on the software. Look at fig. 4.3c below to see how to upload a file from your computer.
(fig. 4.3c)
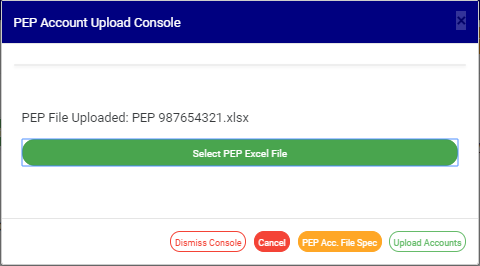
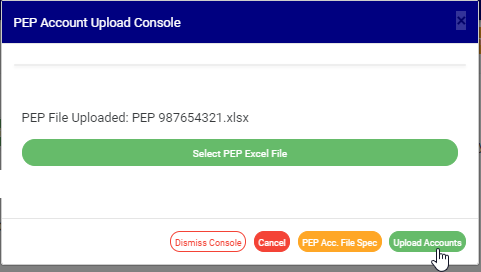
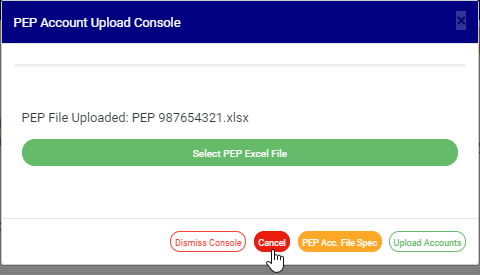
➔ The details in the excel file to be uploaded must be according to the Compliance Planet’s PEP Account File specification. If you do not have the file specification, click on the PEP Acc. File Spec button to download an empty excel file. The file has titled columns according to ADRAPS PEP Specification. Fill in details of the accounts you want to upload, save the changes to the file, and click on Select PEP Excel File to upload the file. See fig. 4.3d for an example of what the PEP Account Upload Console looks like after selecting a file for upload.
(fig. 4.3d)
STEP 3: Click on UPLOAD ACCOUNTS to upload details from the selected file on the Compliance planet. This button is at the bottom-right corner of the console. See fig. 4.3e below for an example.
(fig. 4.3e)
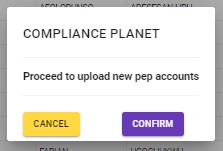
➔This displays a confirmation console as in fig. 4.3f below.
(fig. 4.3f)
Click on cancel to go back to the console.
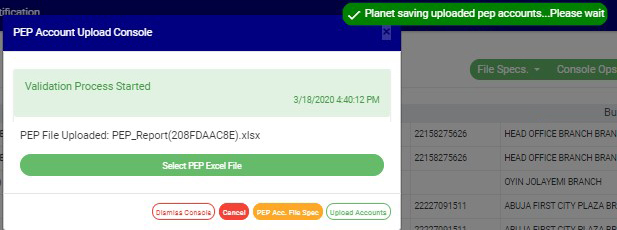
Click on proceed to confirm that you want to upload the PEP Accounts. By clicking on proceed, a notification will be displayed at the top of the console as in fig. 4.3g below.
(fig. 4.3g)
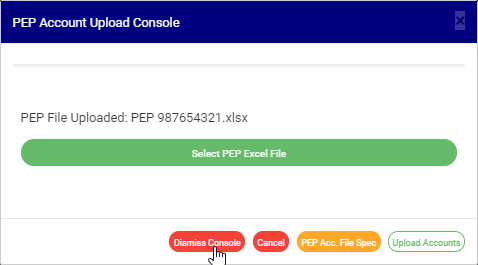
Click on the DISMISS CONSOLE button to close the console. By clicking on this button, the page will be closed but you can come back to it to when you click on Bulk Upload. See the button in fig. 4.3h below.
(fig. 4.3h)
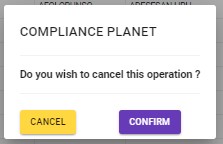
➔ Click on CANCEL as in fig. 4.3i to cancel the operation. This is the red button next to the DISMISS CONSOLE button. It is effective when operation to upload PEP Accounts has started.
(fig. 4.3i)
This displays a confirmation console as in fig. 4.3j.
(fig. 4.3j)
➔ Click on Proceed to confirm you want to cancel the ongoing processes.
➔ Click on Cancel to go back to the PEP Account Upload Console.