The ‘notification’ section of the STR/SAR on the planet handles the instant notification of the compliance team of a bank, upon the identification of a suspicious transaction or activity. Follow these steps to send a STR Notification
STEP 1: Click ‘Send STR’ as in fig. 6.2.1a below
(fig. 6.2.1a)
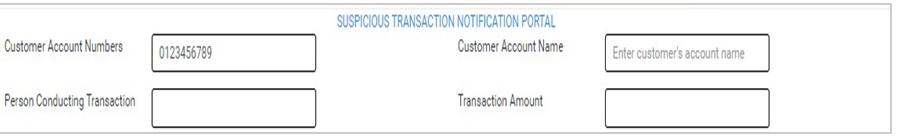
Clicking on ‘SEND STR NOTIFICATIONS’ displays a console as in fig. 6.2b. It is the STR Notification console. The STR notification console requires information about the suspicious transaction.
(fig. 6.2.1b)
STEP 2: Type in the Account number involved in the transaction. See an instance in fig. 6.2.1c. Kindly note that the account number must be valid.
(fig. 6.2.1c)
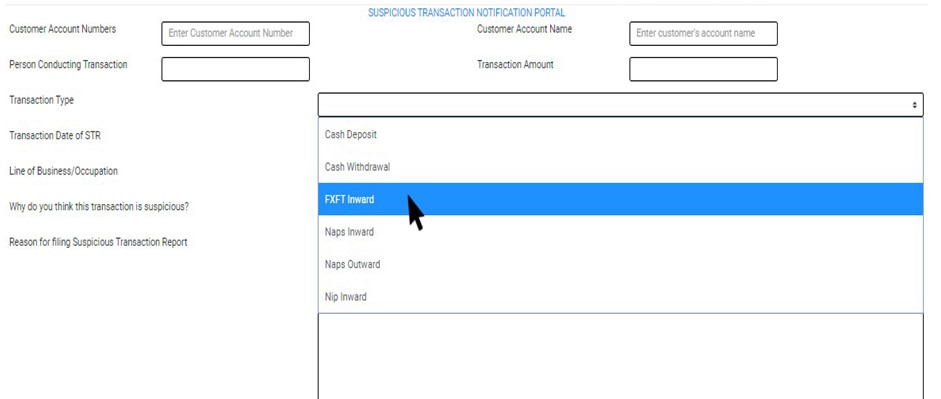
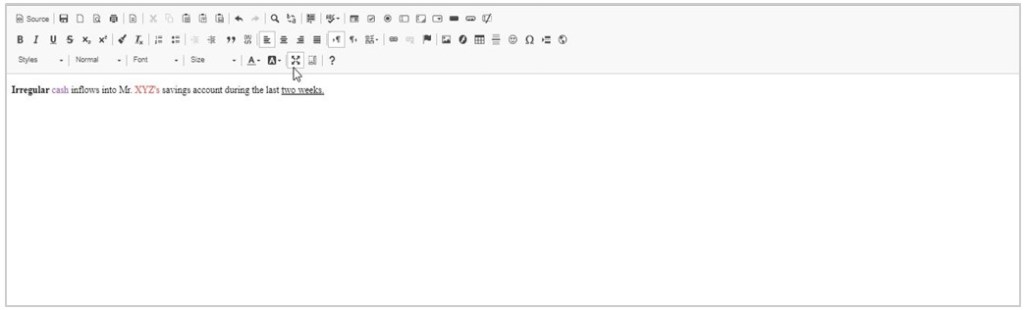
STEP 3: Fill in all other information about the transaction in the editor provided on the console. See an example in fig. 6.2.1d
(Fig. 6.2.1d)
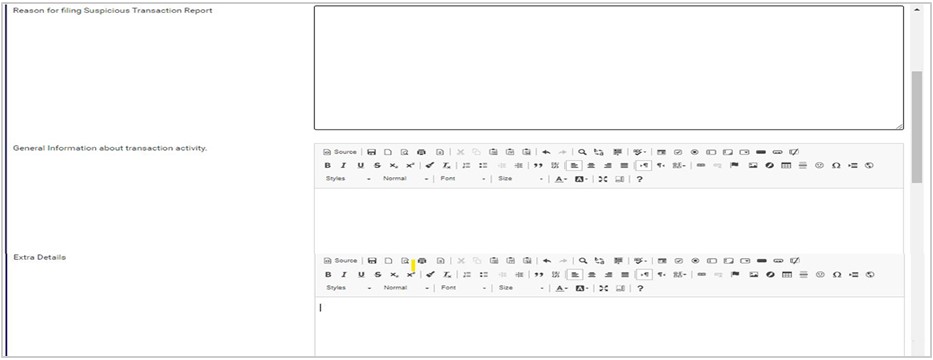
To fill the general information about the transaction and extra details section, there is a rich text editor which allows plain texts, characters and special features like tables, font style, colour, size, alignment, etc to format and customize the texts in your notification. See this feature in fig. 6.2.1e for an example.
(fig. 6.2.1e)
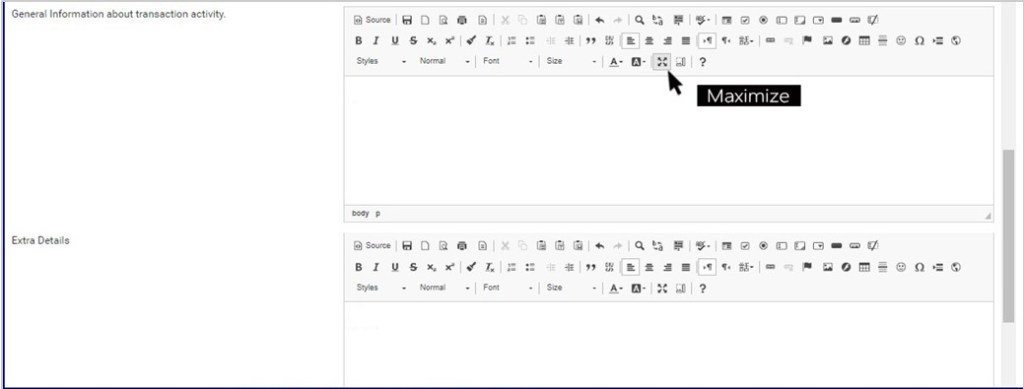
Among the features on the toolbar of the editor, there is a button that can maximize the editor to full screen. This button also minimize the editor’s view back to the console. See this button in fig. 6.2.1f and see fig. 6.2.1g for an example of a full screen view.
(fig. 6.2.1f)
(fig. 6.2.1g)
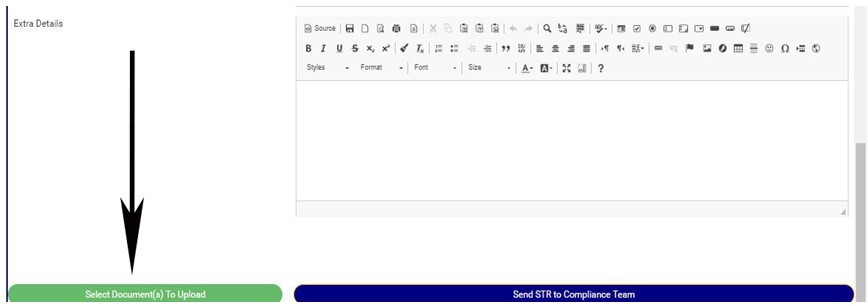
STEP 4: Click on “Select Document(s) to Upload” button to add supporting documents to the STR notification as shown in Fig.6.2.1h below
(fig. 6.2.1h)
Click on ‘SEND STR TO COMPLIANCE TEAM’ to send the information to compliance desk. This button is at the bottom-right corner of the console. Check out this buttons in fig. 6.2.1h above.
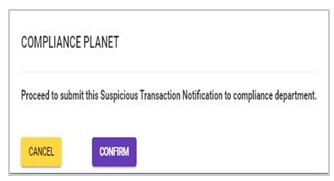
A confirmation console will be displayed when you click on ‘SEND REPORT TO COMPLIANCE TEAM’. Click on CONFIRM to proceed or click on Cancel to go back to the notification console
This operation involves downloading foreign transaction reports. The processes and operations outlined in this report are similar to those described in the CTR FTR Report. Here is how to schedule and download ADRAPS FTR:
NOTE: Only person(s) profiled and assigned the right to ‘Process FTR Reports’ will be able to carry out this operation.
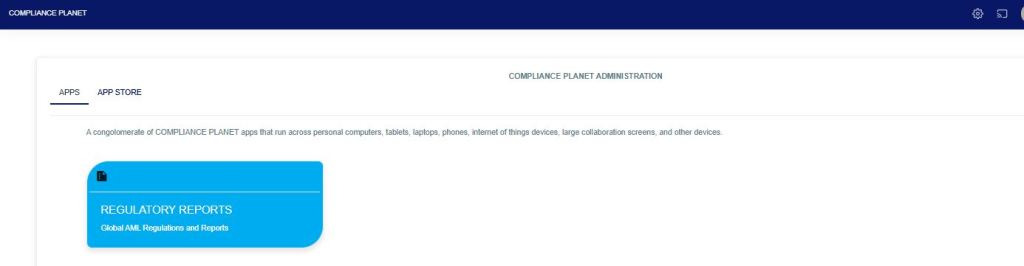
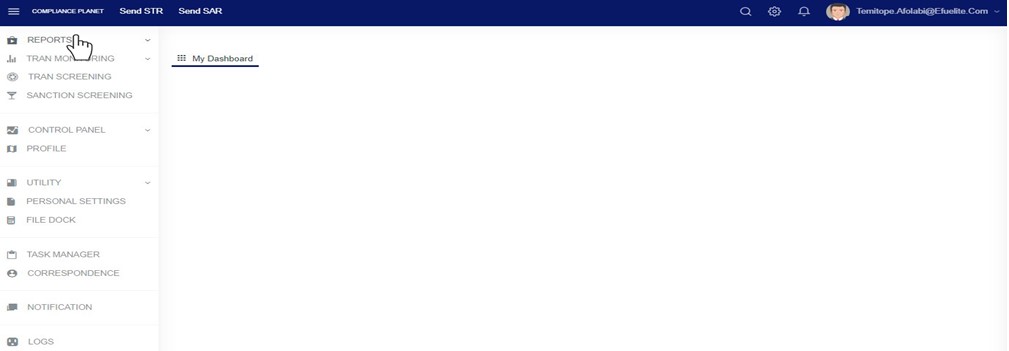
Step 1: From the app dashboard, click on “REGULATORY REPORTS” as in Fig. 3.4a below.
Fig 3.4a
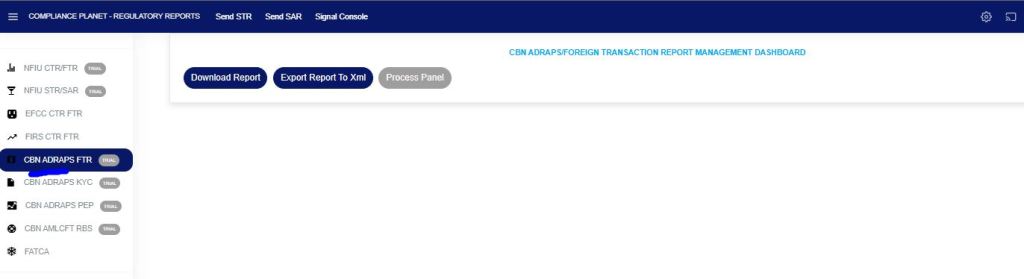
Step 2: Click on “CBN ADRAPS FTR” on the drop-down list, and this displays the ADRAPS FTR page as in Fig. 3.4b below.
Fig 3.4b
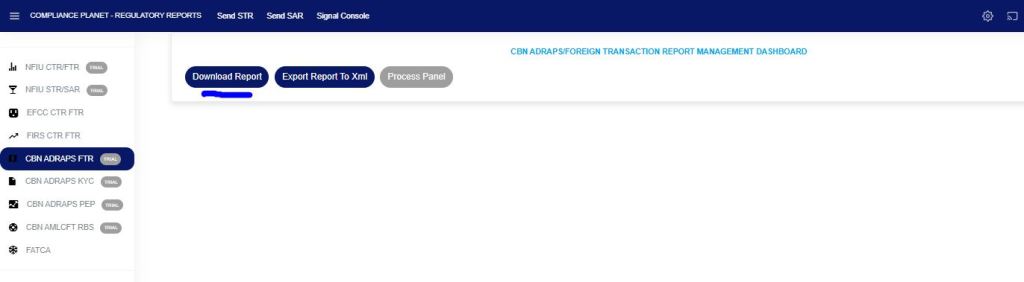
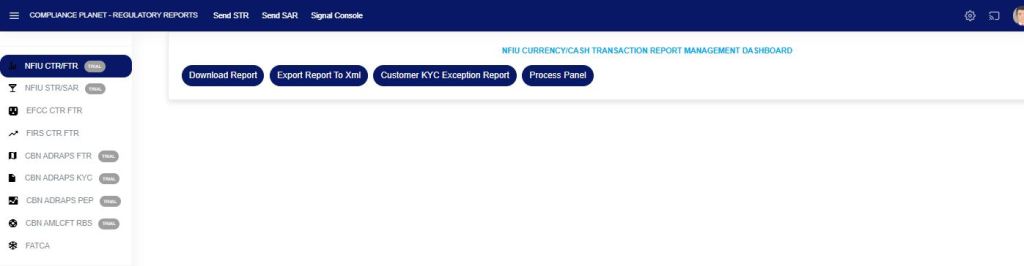
Step 3: From the menu, click “Download Report” as shown in Fig. 3.4c below.
Fig 3.4c
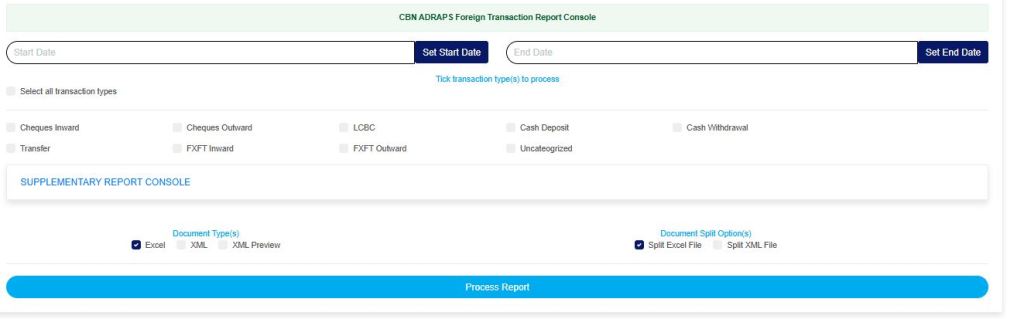
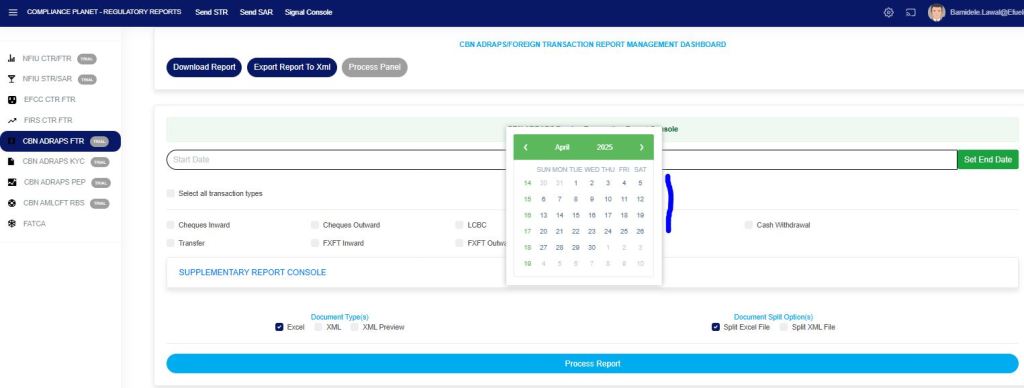
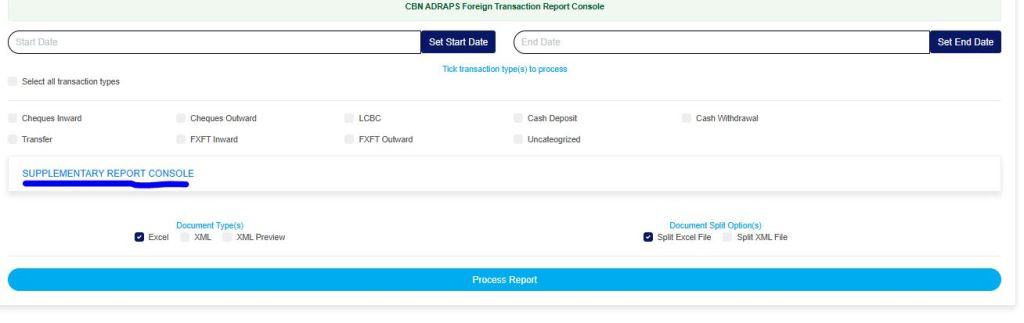
A console will be displayed on the screen as in Fig. 3.4d below, for you to fill in the details and parameters for your report.
Fig. 3.4d
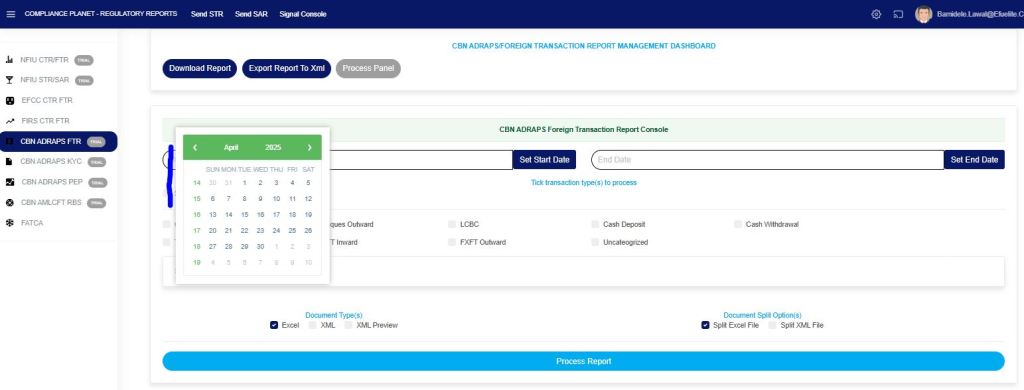
STEP 4: Click on “SET START DATE“and“SET END DATE” to specify the beginning and the end of the period (respectively) for which report(s) to be generated. A calendar drops below the date box, like in Fig. 3.4e and Fig. 3.4f.
Fig. 3.4e
Fig 3.4f
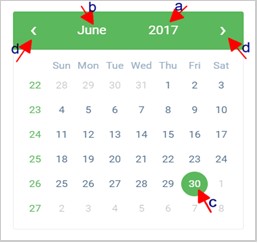
Take a look at the arrows labelled a to d in Fig. 3.4g to study the calendar.
Click on the given year to change it to your year of choice.
Click on the given month to change it to your month of choice.
Then, click on the date of the month.
You can also click on the angle brackets on the calendar [ ‘<’ or ‘>’ ] to go backward or forward.
Fig. 3.4g
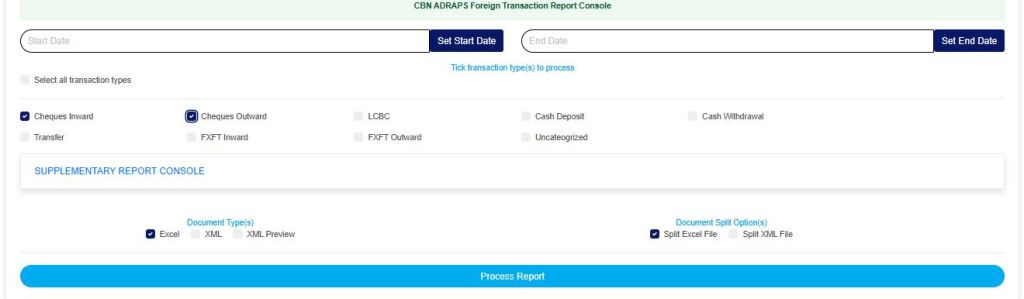
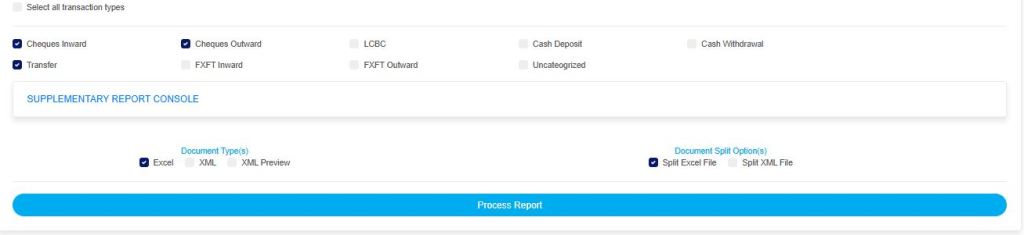
STEP 5: Select the transaction(s) you wish to process by marking their checkboxes. You can select one or more, as in Fig. 3.4h.
Fig 3.4h
You can select all transactions by clicking on ‘Select all transaction types’ as in Fig. 3.4i for processing at once.
Fig 3.4i
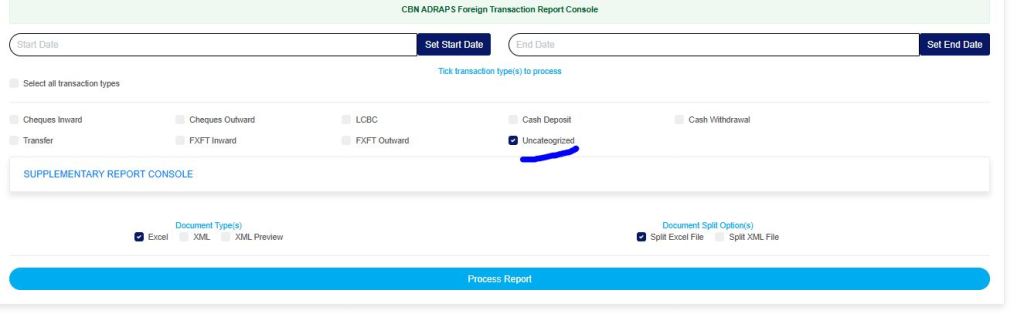
You can also select the “Uncategorized” option, which will give you all reportable transactions (irrespective of the transaction type) for the specified date range, as shown in Fig. 3.4j below. This type of report does not include external customer data.
Fig 3.4j
STEP 6: Click on ‘SUPPLEMENTARY REPORT CONSOLE’ as in Fig 3.4k below to download the report on the Specific account number(s) only within the period selected.
Fig 3.4k
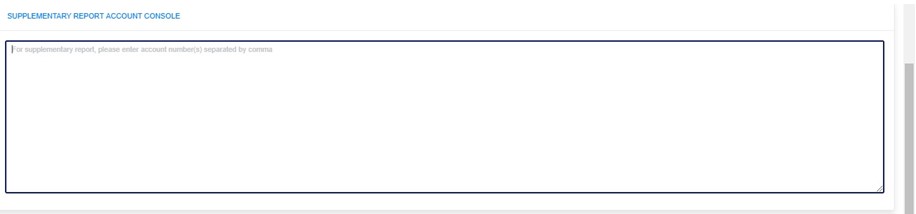
This displays a text box where the account number(s) are to be entered. Note that each account number is to be separated by a comma. See an example in Fig. 3.4l below.
Fig 3.4l
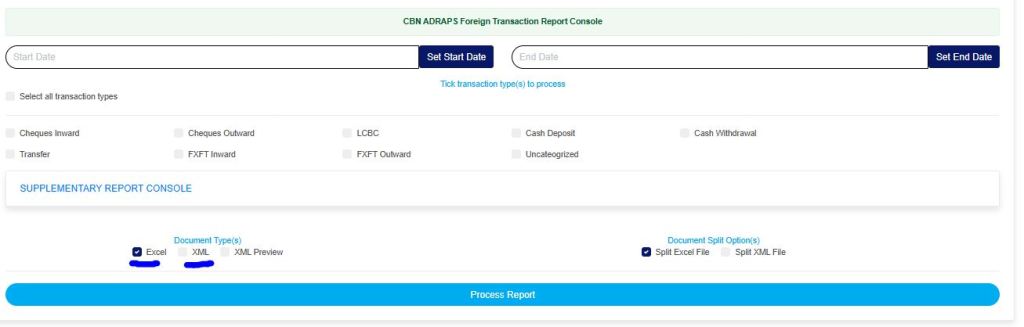
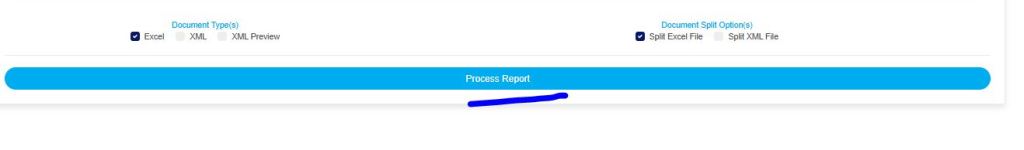
STEP 7: Select the document type; there are two options: Excel or XML. So, tick either of the two or select both. See Fig. 3.4m for an example.
Fig 3.4m
STEP 8: Tick the document split option(s). This step is optional. It all depends on whether you want to combine all the selected FTRs that you wish to process into one file or produce the reports for each FTR in separate files. By clicking on the document split options for either the Excel file or the XML, the software will generate individual reports for the different transaction types. For instance, in the fig. 3.4n, marking the split option will result in the planet generating each ADRAPS FTR file separately. Reports can be exported in Excel format and XML format without any additional steps.
Fig 3.4n
STEP 9: Click on “Process Report” to generate files as in Fig. 3.4o below.
Fig 3.4o
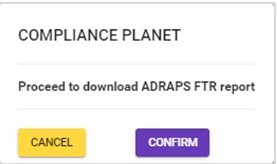
To make changes to your report settings on the ADRAPS FTR Console, click on Cancel. This will take you back to the scheduler.
Click on “Confirm” to confirm your answer.
Fig 3.4p
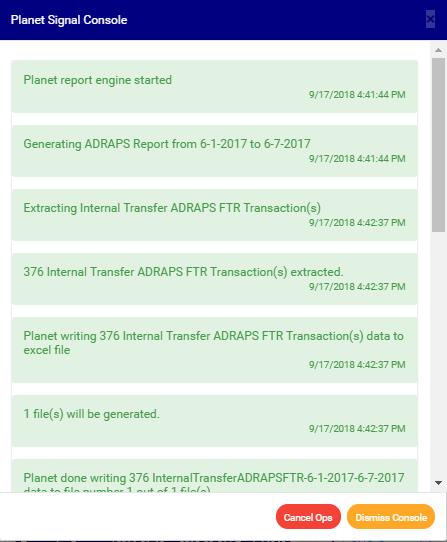
The signal console shows ongoing processes. An example of a signal console is fig. 3.4q below.
Fig 3.4q
You can terminate unfinished processes by clicking CANCEL OPS.
To minimize the signal console, click on “DISMISS CONSOLE“. This button is next to the CANCEL OPS button.
The Compliance Planet enables you to schedule your ADRAPS PEP report in advance. You can manually schedule and download ADRAPS PEP reports. Here is how to do this:
NOTE: Only the person(s) assigned the right to ‘process PEP Report’ can carry out these operations
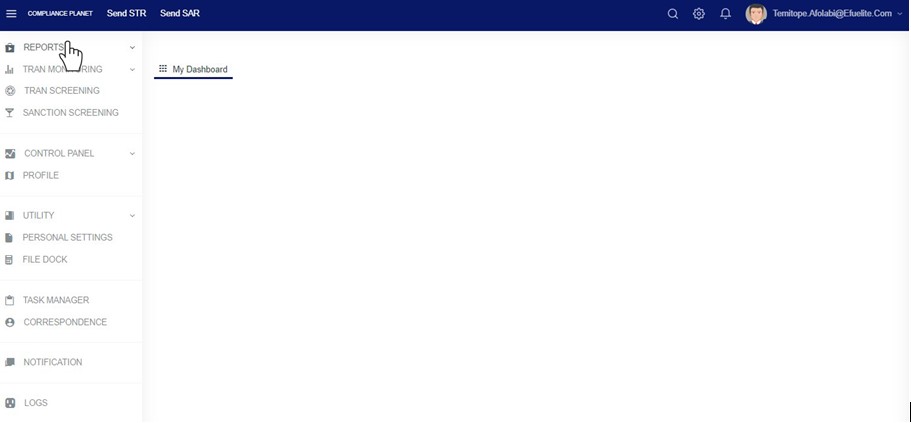
STEP 1: From the app dashboard, click on “REGULATORY REPORTS” as in Fig. 4.3a below.
Fig 4.3a
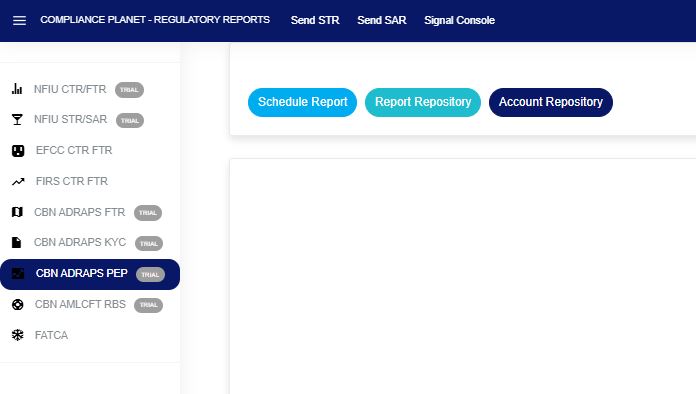
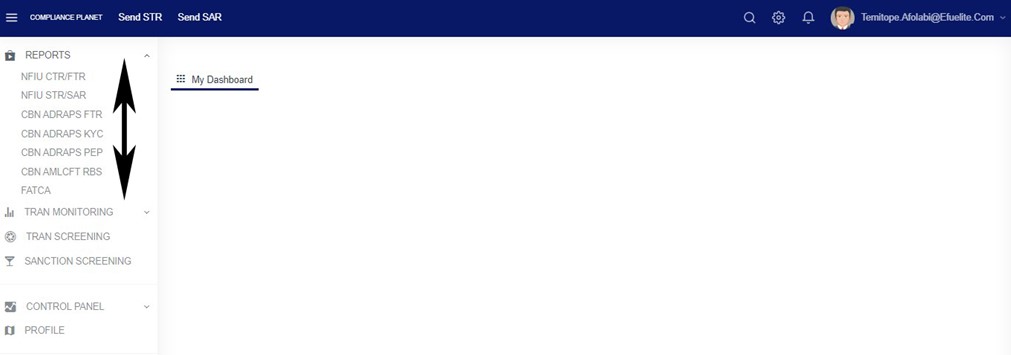
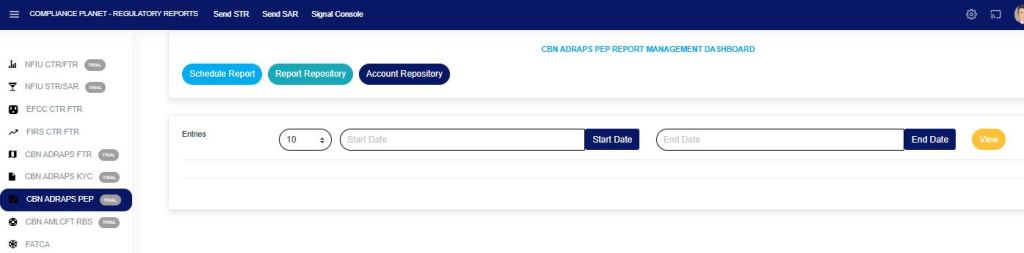
STEP 2: Click ‘CBN ADRAPS PEP’ on the drop-down list and display the PEP page as in Fig. 4.3b below.
Fig 4.3b
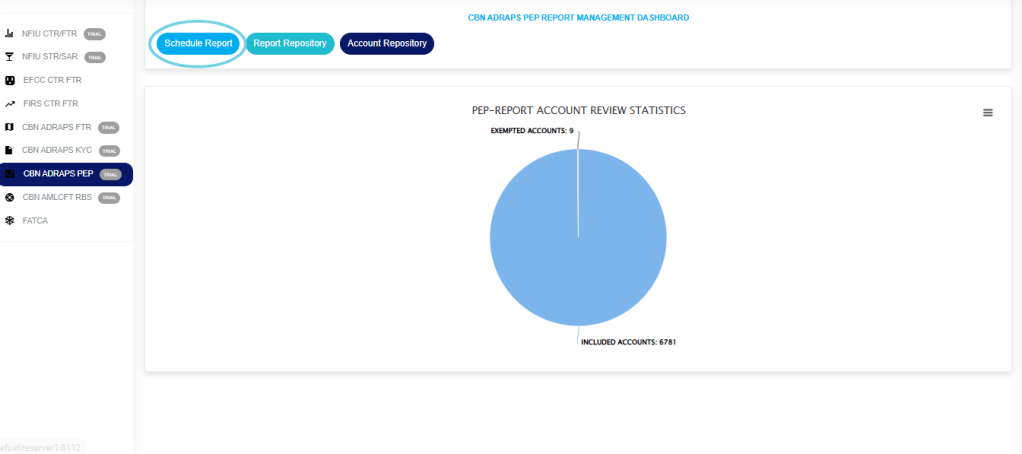
STEP 3: From the menu, click “Schedule Report” as in Fig. 4.3c below.
Fig 4.3c
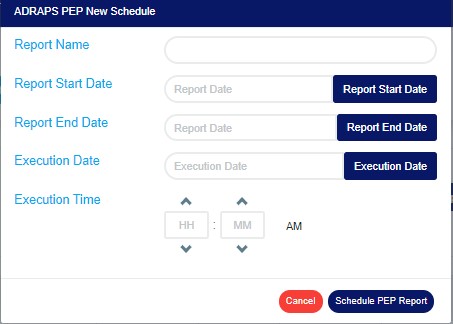
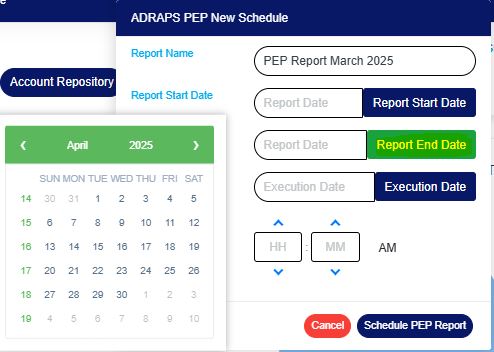
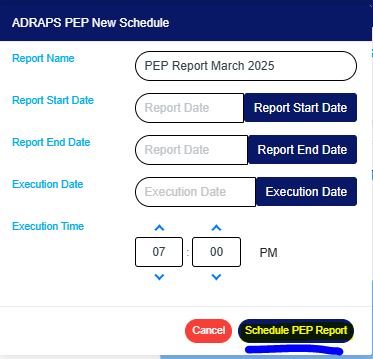
This displays an ‘ADRAPS PEP Scheduler’ as in Fig. 4.3d below.
Fig 4.3d
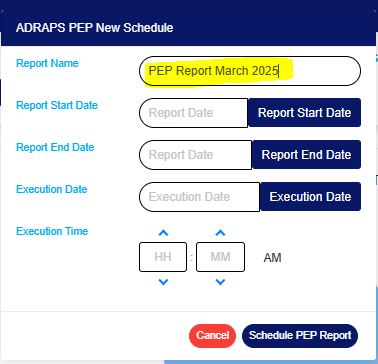
STEP 4: Fill in the name of your report in the “REPORT NAME” box. The report name should be any title of your choice for easy identification. (See Fig. 4.3e for an example)
Fig 4.3e
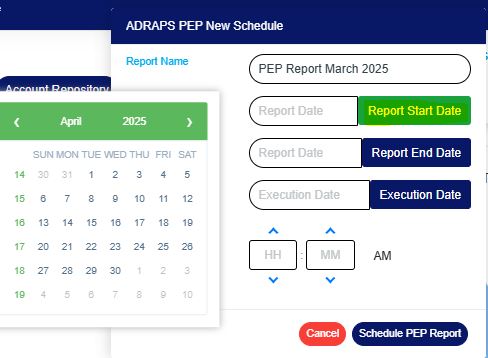
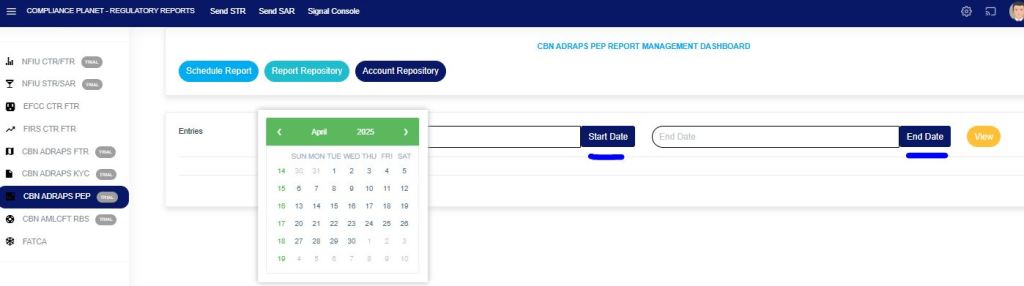
STEP 5: Click the “REPORT START DATE” and “REPORT END DATE” buttons to select the start date and end date, respectively, for generating the report. See examples in Fig. 4.3f and Fig. 4.3g below.
Fig 4.3f
Fig 4.3g
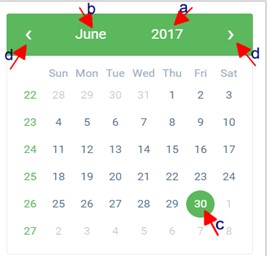
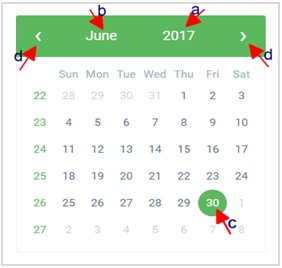
Look at the arrows labelled a to d in Fig. 4.3h to study the calendar.
Click on the given year to change it to your year of choice.
Click on the given month to change it to your month of choice.
Then, click on the date of the month.
You can also click on the angle brackets on the calendar [ ‘<’ or ‘>’ ] to go backward or forward.
Fig 4.3h
STEP 6: Click on the “EXECUTION DATE” button to select the date you want your ADRAPS PEP report processed from a calendar, as shown in Fig. 4.3i below. The calendar operates similarly to the one shown in Fig. 4.3h above.
Fig 4.3i
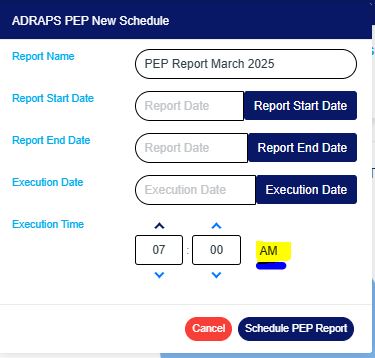
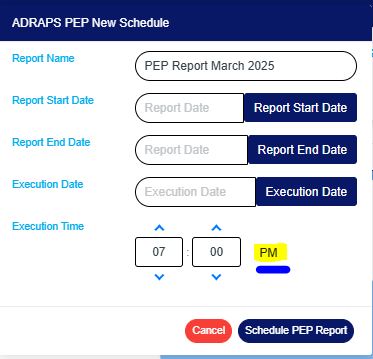
STEP 7: Set your report “EXECUTION TIME” by filling in the ‘hour’ and the ‘minute’ you want the report to be processed. There is a button next to the hour and minute boxes used for switching between AM and PM. See examples in Fig. 4.3j and 4.3k below.
Fig 4.3j
Fig 4.3k
STEP 8: Click ‘SCHEDULE PEP REPORT’ to create your report. Click “CANCEL” to close the console. These buttons are at the bottom-right corner of the console. See them in fig. 4.3l below.
Fig 4.3l
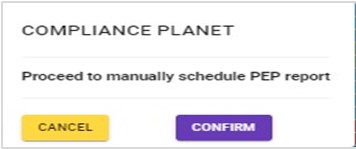
Click on ‘SCHEDULE PEP REPORT’ as in Fig. 4.3l above. A confirmation console will be displayed. Click on “CONFIRM” to confirm your request to schedule the report. Click “CANCEL” to go back to the scheduler. See Fig. 4.3m below for an example of the confirmation console.
Note: Only persons assigned right(s) to ‘view CTR reports’ and ‘process CTR reports’ will be able carry out this operation.
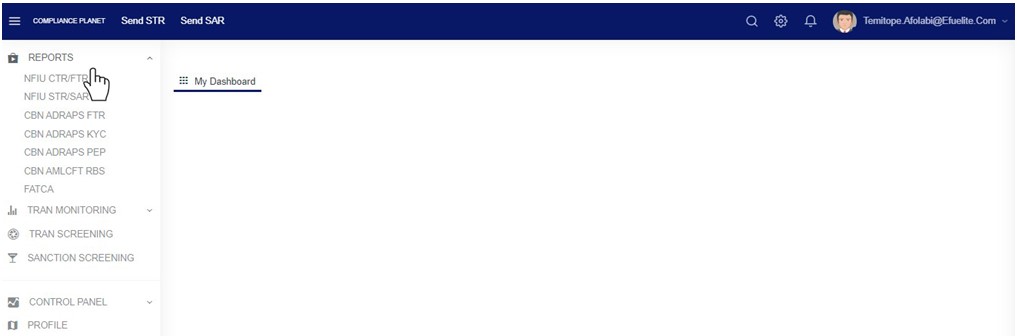
From the left hand side menu, Click on ‘REPORTS’ as shown below
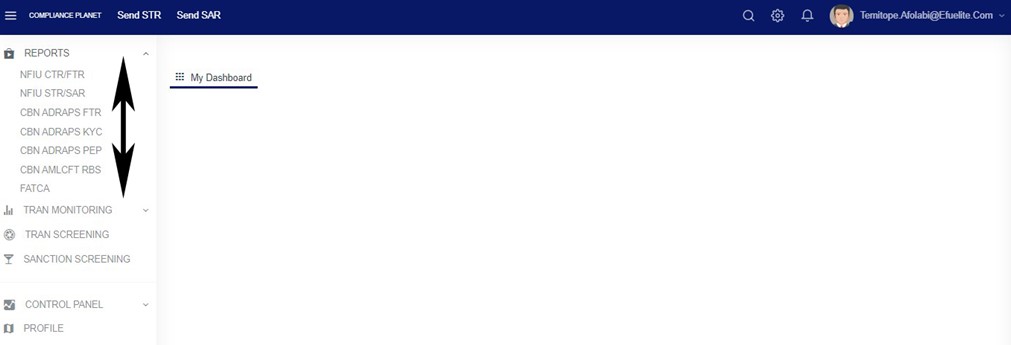
This will display a drop down as shown below. The drop down lists the report types available on the compliance planet software.
Click ‘NFIU CTR/FTR’ on the drop down list. See an example below.
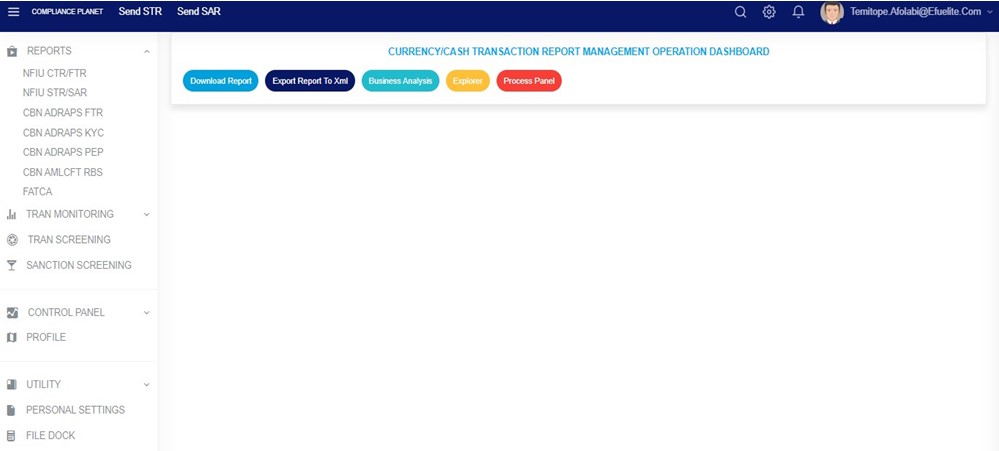
This will display the NFIU CTR/FTR page
Fig
STEP 1: From the top menu , Click “Explorer” as in Fig 2.6a below
Fig 2.6a
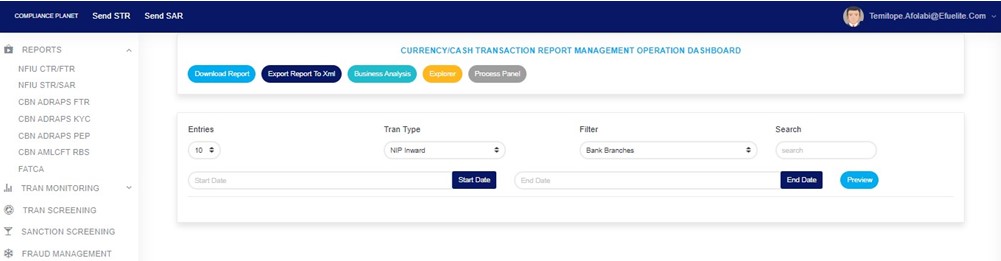
This displays a page as in Fig 2.6b below
2.6b
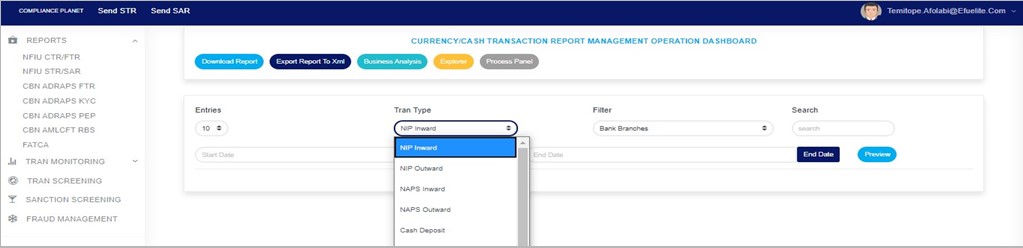
STEP 2: Select the transaction type you want to explore by clicking on the Tran Type box. A drop-down will be displayed under the box as in fig. 2.6c. Select any transaction type of your choice.
(fig. 2.6c)
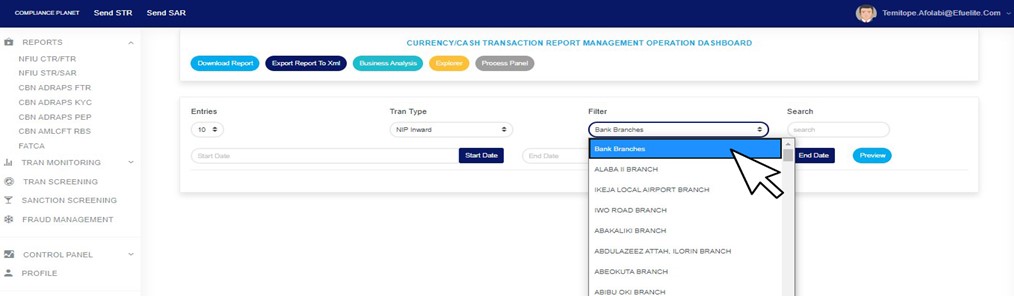
STEP 3: Click on the filter box to select a particular bank branch you want to see transactions for. (See the example in fig. 2.6d). If you want to see the transactions for all branches, select bank branches. It is the first option on the filter list.
(Fig. 2.6d)
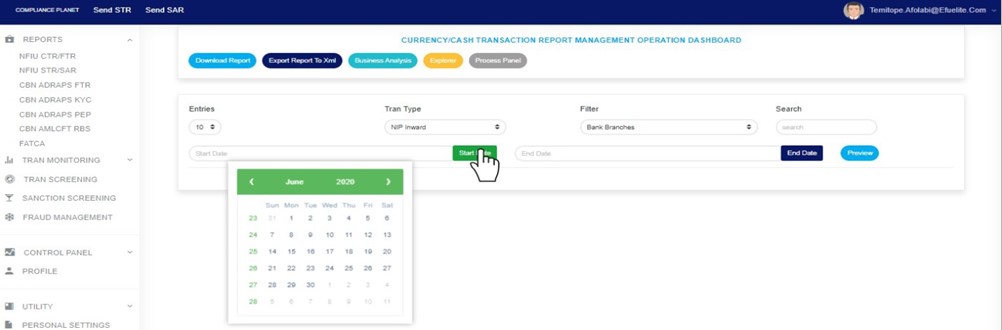
STEP 4: Click on the Start date button and End date button to specify the beginning of the period and the end of the period of the transactions you want to see respectively. A calendar drops below the date box when you click any of the date buttons. (See fig. 2.6e)
(fig. 2.6e)
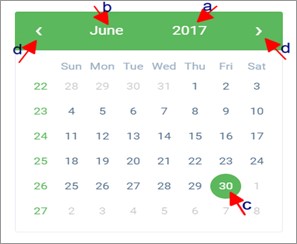
Take a look at the arrows labelled a to d in fig. 2.6f to study the calendar.
Click on the given year to change it to your year of choice.
Click on the given month to change it to your month of choice.
Then, click on the date of the month.
You can also click on the angle brackets on the calendar [ ‘<’ or ‘>’ ] to go backward or forward.
(fig. 2.6f)
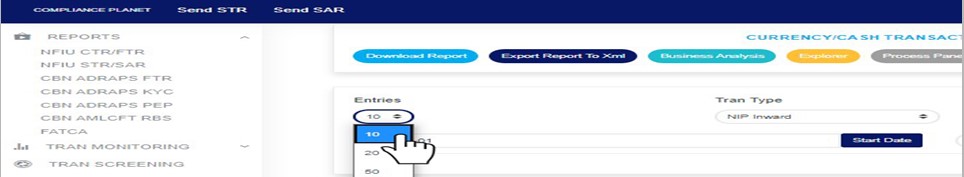
STEP 5: Click on the entries box to change the number of transactions you want to see per page. (See the drop-box in fig. 2.6g. below)
(Fig. 2.6g)
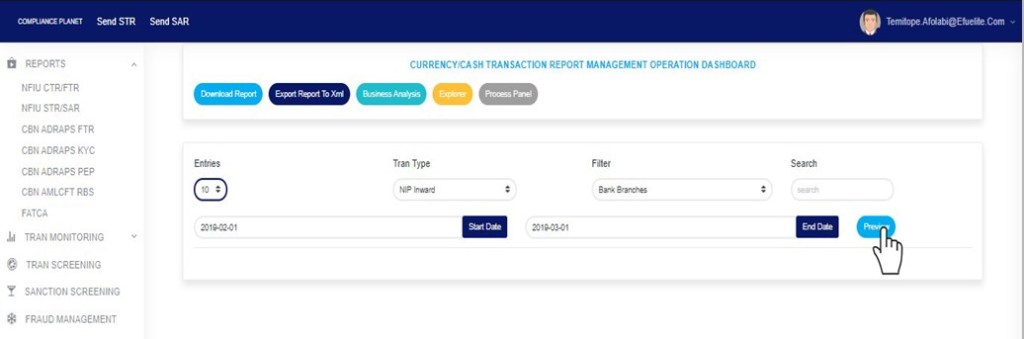
STEP 6: To see the transactions, click on PREVIEW as in fig 2.6h.You can change your start date, end date, or bank branch or number of entries per page as you wish but always click on the preview button to see the changes you’ve made. It is the preview button that effects the changes you have made. See fig 2.6h.
(fig. 2.6h)
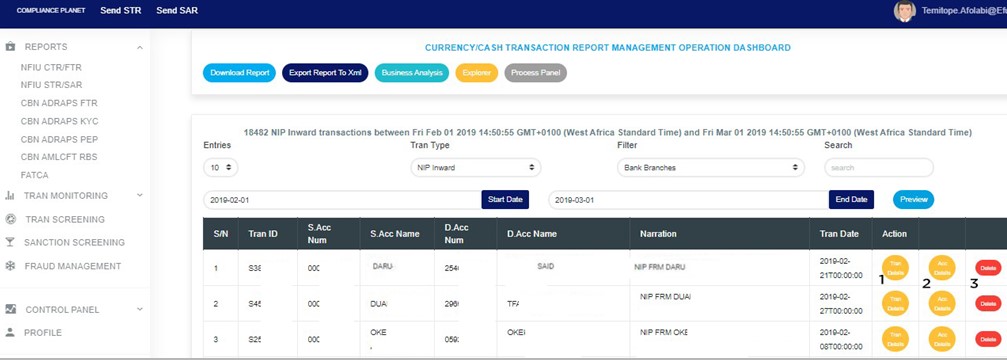
After clicking on the preview button, the transactions appear with their respective details row by row and three (3) action buttons; ‘Tran Details’, ‘Acc Details’ and ‘Delete’. See an example in fig 2.6i below. White arrows indicate the action buttons.
(fig 2.6i)
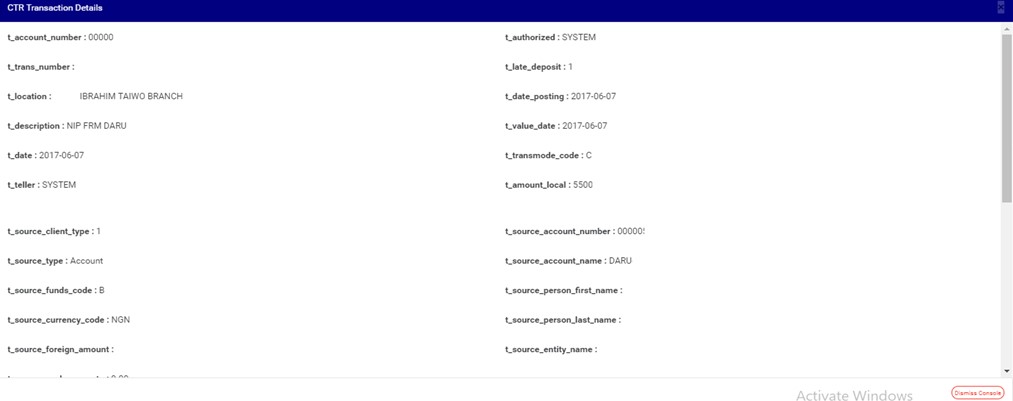
clicking Tran Details button (arrow 1 in fig 2.6i) displays a page with the details of the transaction on that row you clicked on like the example in fig 2.6j. The detail covers information about debit and credit part of the transaction according to the CTR FTR schema.
(fig 2.6j)
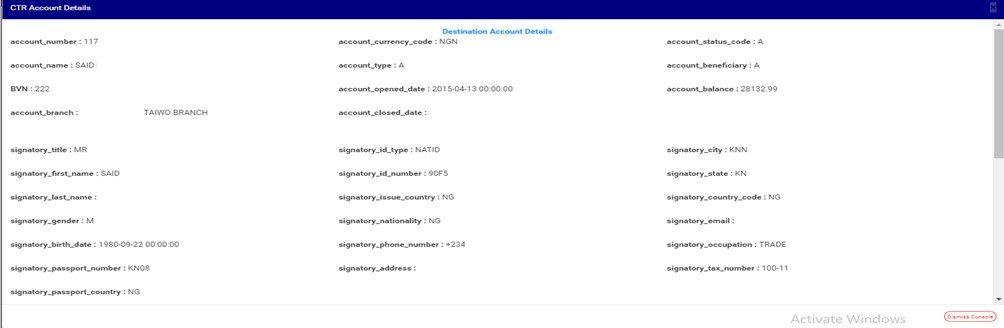
Clicking Acc Details button (arrow 2 in fig 2.6i) displays a page with the details of the account involved in the transaction on that row you clicked on. See fig 2.6k to see an example of a CTR FTR Account details page.
(fig 2.6k)
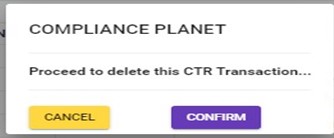
To delete the transaction from the compliance planet, click on the Delete button (This is labelled as arrow 3 in fig 2.6i). This will display a confirmation console to confirm your action. It looks like fig. 2.6l. Click on confirm to delete the transaction or cancel to close the console.
The Compliance Planet maintains a record of all PEP reports that have been manually scheduled. In this section, you will learn how to access your scheduled PEP report and explore additional features to enhance your experience.
NOTE: Only person(s) assigned the right to ‘view PEP Report’ can carry out these operations.
STEP 1: From the app dashboard, click on “REGULATORY REPORTS” as in Fig. 4.4a below.
Fig 4.4a
STEP 2: Click ‘CBN ADRAPS PEP’ on the drop-down list and display the PEP page as in Fig. 4.4b below.
Fig 4.4b
STEP 3: From the menu, click “Report Repository” as in Fig. 4.4c below.
Fig 4.4c
Thiswill display a page as in Fig. 4.4c below.
Fig 4.4c
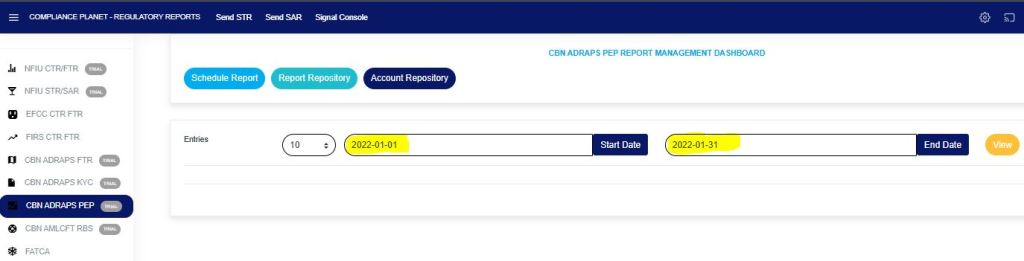
STEP 4: Click on the “START DATE” button/box and the “END DATE” button/box to set the beginning and the end of the period in which the reports you want to see have been scheduled. See how to do this in Fig. 4.4d below. Fig. 4.4e shows a labeled calendar to guide you on how to use it effectively.
Fig 4.4d
Take a look at the arrows labelled a to d in Fig. 4.4e to study the calendar.
Click on the given year to change it to your year of choice.
Click on the given month to change it to your month of choice.
Then, click on the date of the month.
You can also click on the angle brackets on the calendar [ ‘<’ or ‘>’ ] to go backward or forward.
Fig 4.4e
For instance, to see reports for January 2022, the start and end dates would be 2022-01-01 and 2022-01-31, respectively. See an example in Fig. 4.4f below.
Fig 4.4f
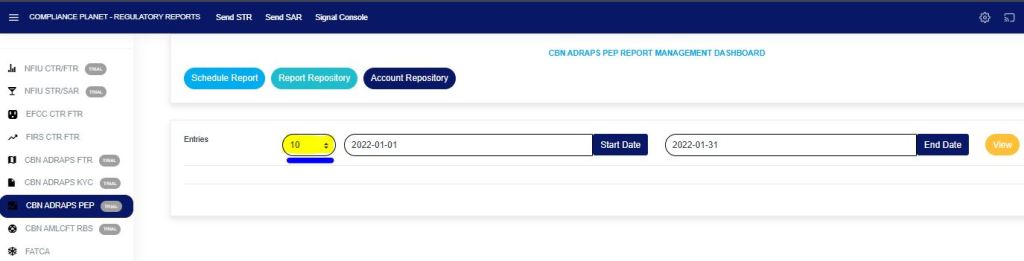
You can increase the number of reports you want to see per page by clicking on the “ENTRIES” box. Pick any number of entries per page of your choice. See Fig. 4.4g below for an example.
Fig 4.4g
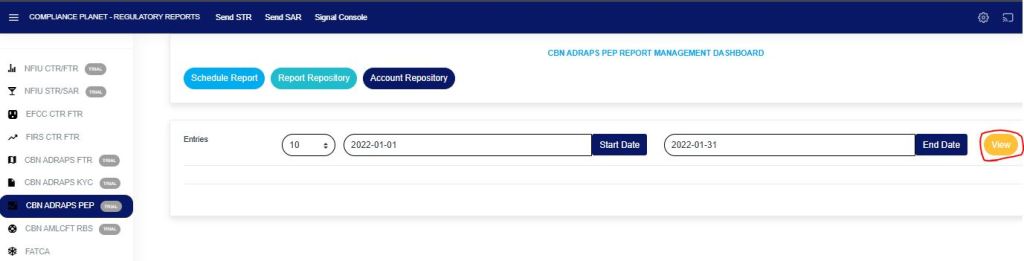
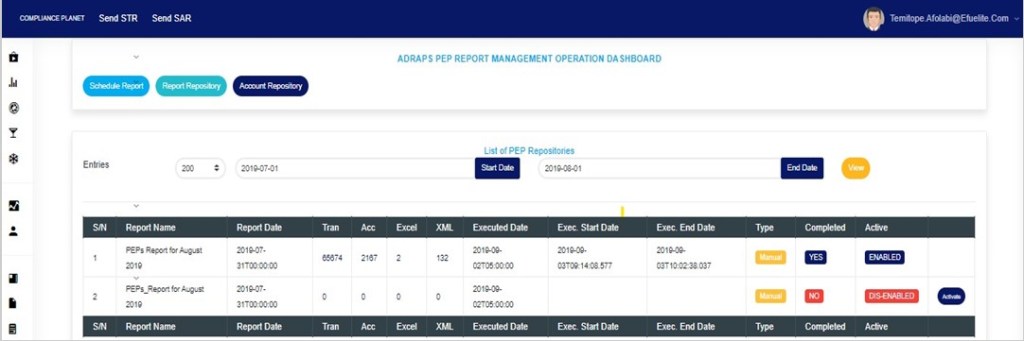
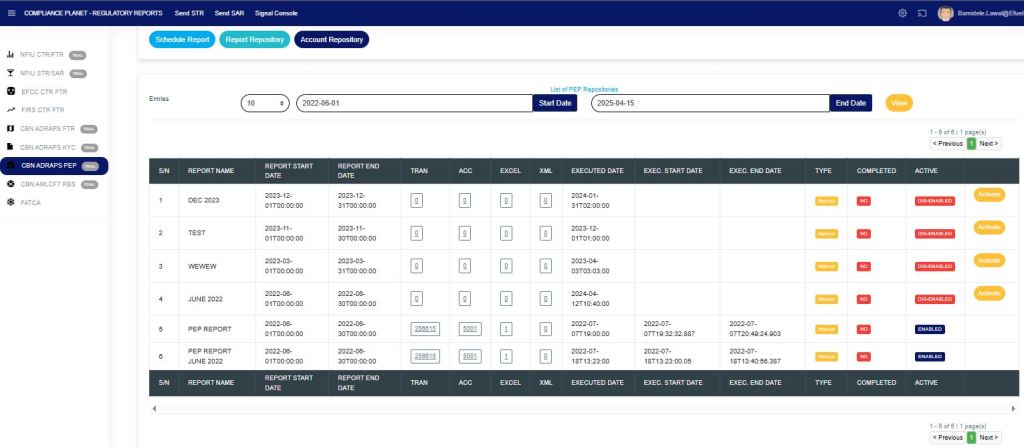
STEP 5: Click on the “VIEW” button to see the reports. It is an orange button at the upper area of the page, next to the END DATE box. By doing this, the planet will initiate a search, and reports that were scheduled for the period you entered in the date boxes will appear, as shown in Fig. 4.4h. Click on the view button to see the results of the example in Fig. 4.4i.
Fig 4.4h
Fig 4.4i
You can make changes to your date, but to effect the changes you have made on the page, click on VIEW. For instance, when you change the date entries, click on View to see the reports for the new date range you have just set.
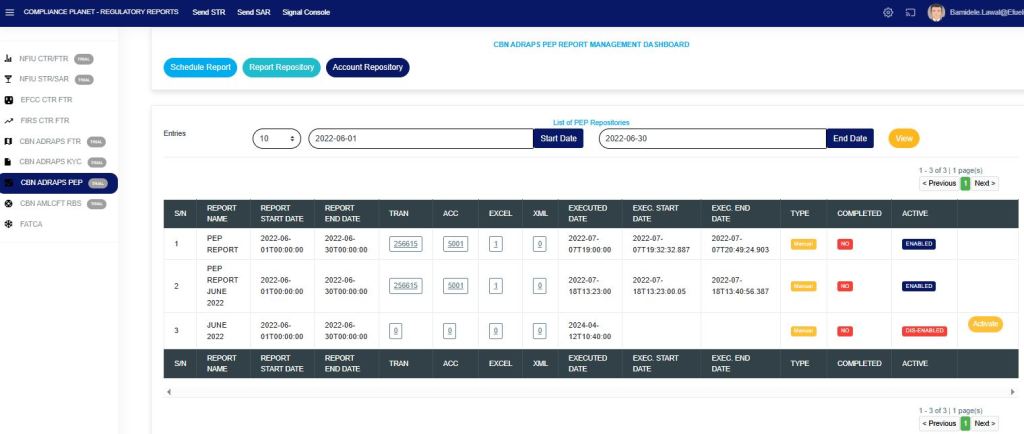
The results of the report(s) that fall within that date range will be displayed row by row.
On every row, for each report, the software will give information about the Number of transactions contained in each report. Number of accounts involved. Number of Excel files and XML files the software has exported report information into. Execution date and time. Start date and end date. Type of report. Completed column showing a comment on whether the processing of the report has been completed or not. See Fig. 4.4i above.
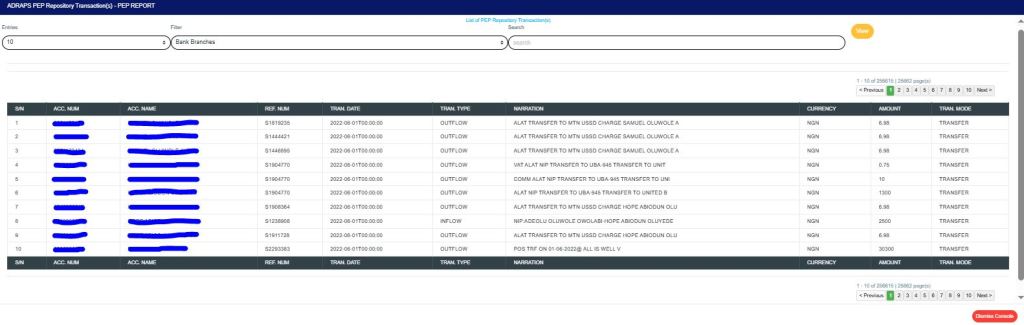
TRAN The numbers under the ‘Tran’ column (in Fig. 4.4i) represent the number of transactions carried out by the PEPs that are being reported in the respective reports. Click on the “Number of “transactions” and a page displaying a list of transactions carried out by the PEPs in the particular report will be displayed. See Fig. 4.4j below for an example of a PEP repository transaction(s) page.
Fig 4.4j
PEP REPOSITORY TRANSACTION PAGE The PEP Repository Transaction page has various features, and here are the following steps on how to use them:
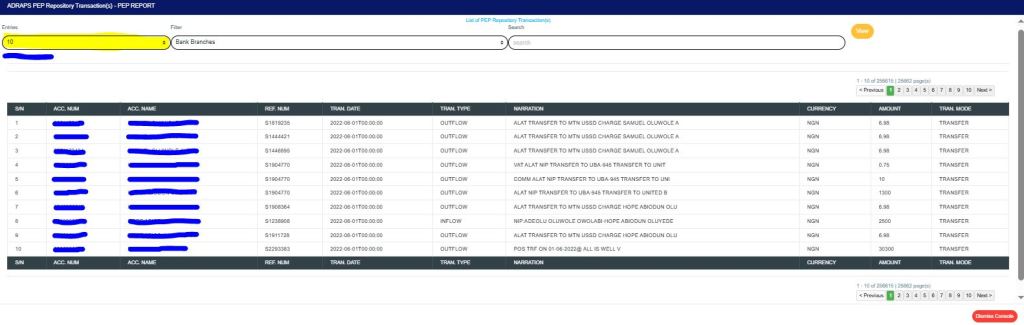
ENTRIES Click on the “Entries” box to adjust the number of transactions you want to see per page. See Fig. 4.4k below for an example of how to do this. The software will automatically apply your changes.
Fig 4.4k
FILTER Click on the “Filter” box to select a bank branch for which you want to see PEP transactions. See Fig. 4.4l below for an example of how to do this.
Fig 4.4l
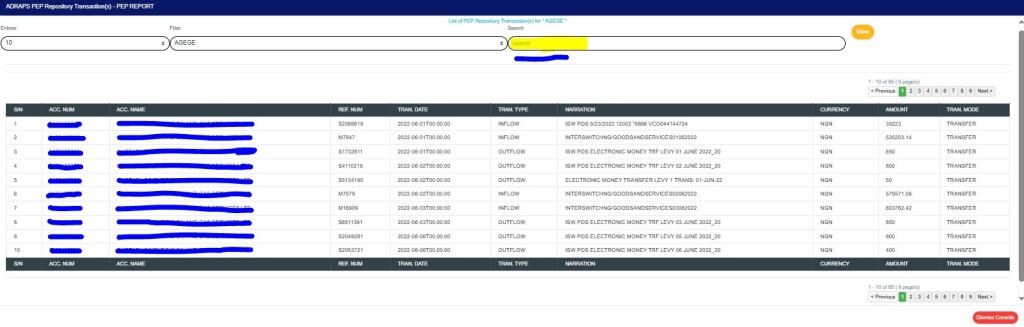
VIEW After selecting the bank branch of your choice in the filter box as in Fig. 4.4l above, click on “VIEW” to see the transactions attached to the selected bank branch. See Fig. 4.4m for an example on how to do this.
Fig 4.4m
SEARCH To search for a particular transaction using an account number, account name, reference number, transaction type, narration, amount, or transaction mode. Click the “SEARCH” box and type in the search term as in the example in Fig. 4.4n below. The software will search out the search term as soon as you type in a character in the search box. You do not have to click on the VIEW button.
Fig 4.4n
PREVIOUS AND NEXT At the top-right and bottom-right corners, you see information about the number of pages. All the page numbers represent buttons for each page. By clicking on any page number, the software takes you to that particular page. Click on the “NEXT” button to take you to the next page. Click on the “PREVIOUS” button to navigate to the previous page.
DISMISS To close this page, click on the “DISMISS” button at the bottom-right corner of the page.
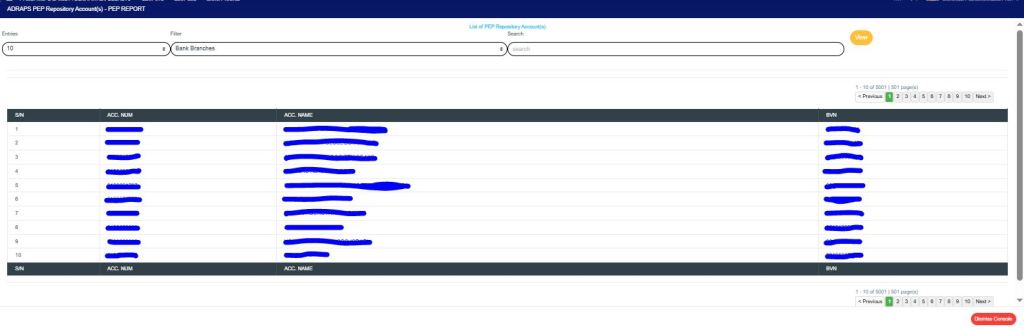
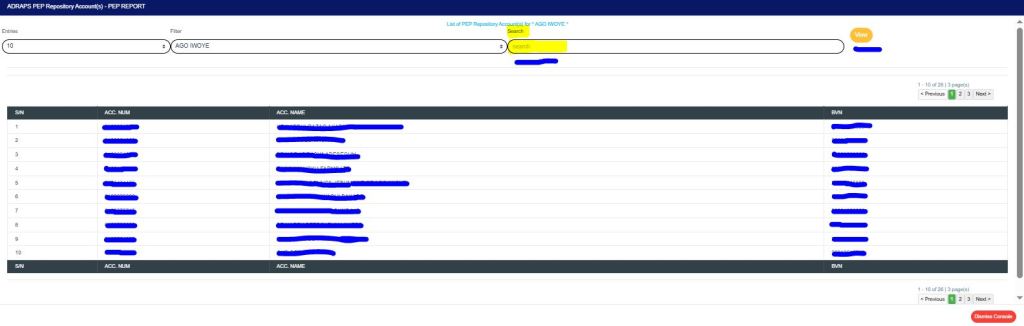
ACC The numbers under the “ACC” column (in Fig. 4.4i) represent the number of PEP accounts being reported in each report. Click on the “Number of accounts” option, and the software will display a page listing the PEP accounts and their respective details. See Fig. 4.4o below to see an example of the PEP repository account(s) page.
Fig 4.4o
PEP REPOSITORY ACCOUNT(S) PAGE The PEP Repository Account(s) page has various features, and here are the following steps on how to use them:
ENTRIES Click on the “ENTRIES” box to adjust the number of accounts you want to see per page.
FILTER Click on the “FILTER” box to select a bank branch for which you want to see PEP accounts.
VIEW After selecting the bank branch of your choice, click on “VIEW” to see the accounts attached to the selected bank branch. See Fig. 4.4p below for an example of how to do this.
Fig 4.4p
SEARCH You can search for a particular account using the account number, account name, or BVN. Click the “SEARCH” box and type in the search term as in the example in Fig. 4.4q below. The software will automatically search for your search term as soon as you type in a character in the search box. You do not have to click on the VIEW button.
Fig 4.4q
PREVIOUS AND NEXT At the top-right and bottom-right corners, you see information about the number of pages. All the page numbers represent buttons for each page. By clicking on any page number, the software takes you to that particular page. Click on the “NEXT” button to take you to the next page. Click on the “PREVIOUS” button to navigate to the previous page.
DISMISS To close this page, click on the “DISMISS” button at the bottom-right corner of the page.
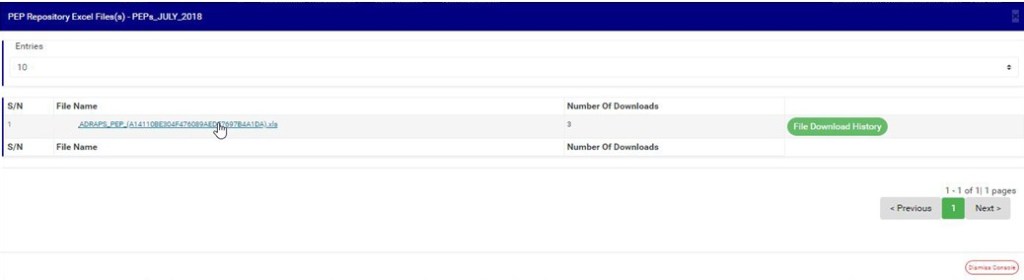
EXCEL The numbers under the ‘Excel’ column (in Fig. 4.4i) also represent the number of Excel files that the software has written the report into. Click on the “Number of Excel files”; a page will display as shown in Fig. 4.4r below.
Fig 4.4r
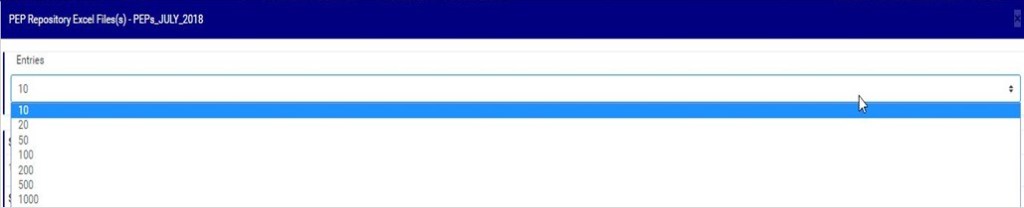
PEP REPOSITORY EXCEL FILE(s) PAGE The PEP Repository Excel file(s) page gives information about the Excel file name(s), the number of times users have downloaded the file, and the download history. Here are the steps on how to make use of the PEP Repository Excel file(s) page features:
ENTRIES Click on the “ENTRIES” box to adjust the number of Excel files you want to see per page. See Fig. 4.4s below for an example of how to do this. The software will automatically apply your changes whenever you make this change.
Fig 4.4s
FILE NAME Click on the “FILE NAME” to download the Excel file to your computer. The file name is underlined, and the download happens immediately! The number of downloads changes immediately when you click on the file name. Compliance Planet is fast and easy! See Fig. 4.4t below for an example of how to download the PEP Excel file.
NOTE: Only person(s) assigned the right to ‘view PEP Report’ and ‘download PEP Report’ can carry out these operations.
Fig 4.4t
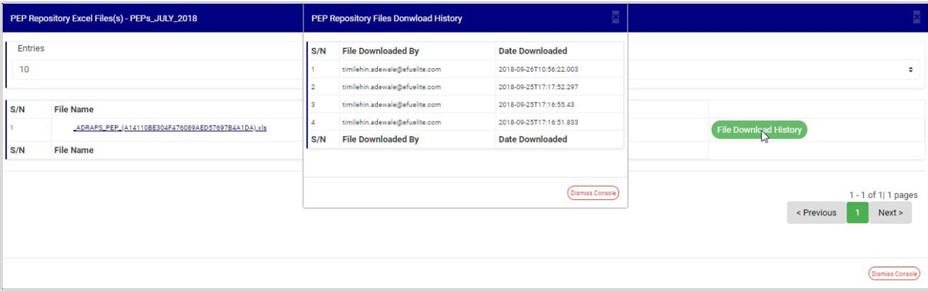
FILE DOWNLOAD HISTORY To see who downloaded the file and the time of download, click on the ‘File Download History’ button. A console will be displayed as in Fig. 4.4u below. Close the console using the “DISMISS” button at the bottom-right corner of the console.
Fig 4.4u
PREVIOUS AND NEXT At the top-right and bottom-right corners, you see information about the number of pages. All the page numbers represent buttons for each page. By clicking on any page number, the software takes you to that particular page. Click on the “NEXT” button to take you to the next page. Click on the “PREVIOUS” button to navigate to the previous page.
DISMISS To close this page, click on the “DISMISS” button at the bottom-right corner of the page.
XML The numbers under the ‘XML’ column (in Fig. 4.4i) also represent the number of XML files into which the software has written the respective report. Clicking on the number of XML files displays a page as in Fig. 4.4v below.
Fig 4.4v
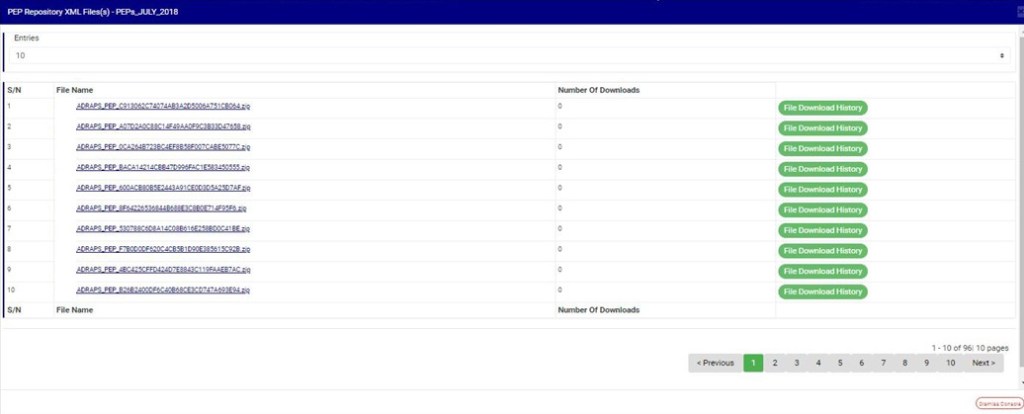
PEP REPOSITORY XML FILE(S) PAGE The PEP Repository XML file(s) page also gives information about the XML file name(s), the number of times users have downloaded the file(s), and the download history. There are 500 PEP transactions per XML file. The features on the PEP Repository XML file(s) page function similarly to those on the PEP Repository Excel file(s) page. Here are the steps on how to make use of the PEP Repository Excel file(s) page features:
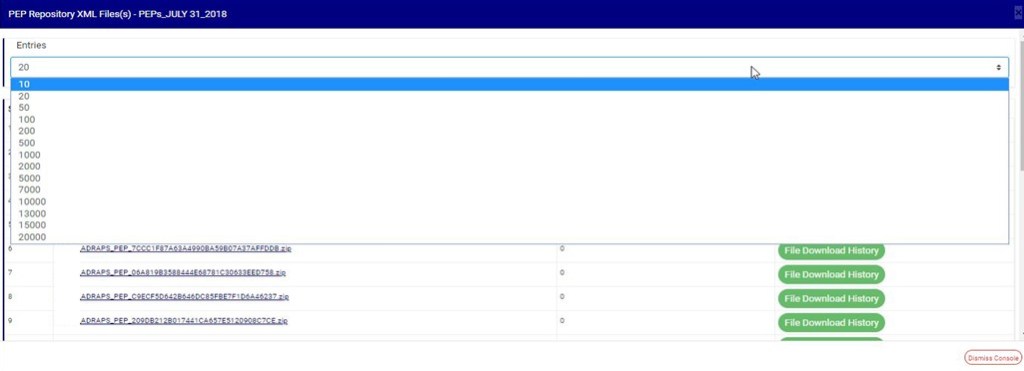
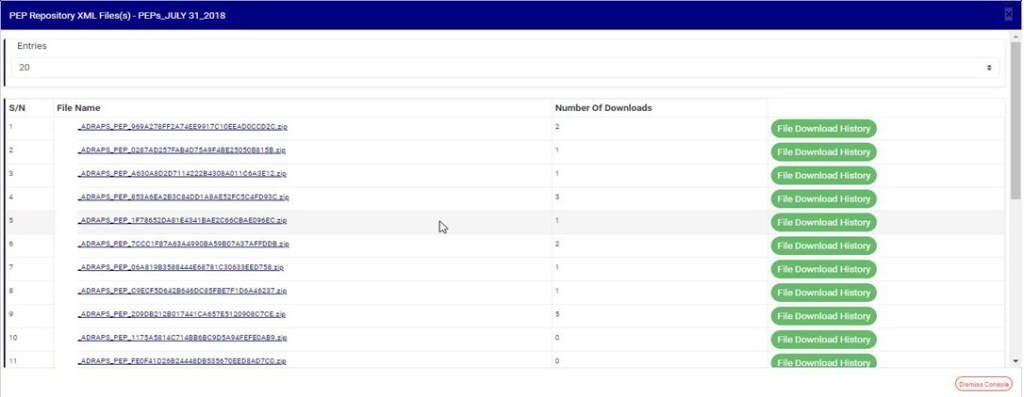
ENTRIES Click on the “ENTRIES” box to adjust the number of XML files you want to see per page. See Fig. 4.4w below for an example of how to do this. The software will automatically apply your changes whenever you do this.
Fig 4.4w
FILE NAME Click on the “FILE NAME” to download the XML file to your computer. The number of downloads changes immediately when you click on the file name. The file name is underlined, and the download is immediately also! See Fig. 4.4x below for an example of how to download a PEP XML file.
NOTE: Only person(s) assigned the right to ‘view PEP Report’ and ‘download PEP Report’ can carry out these operations.
Fig 4.4x
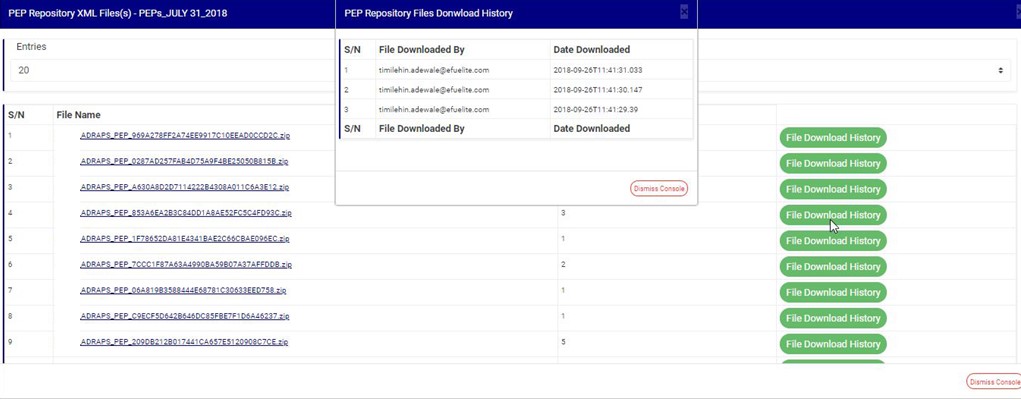
FILE DOWNLOAD HISTORY To see who downloaded the file and the time of download, click on the ‘File Download History’ button. A console will be displayed as shown in Fig. 4 .4 below. Close the console using the “DISMISS” button at the bottom-right corner of the console.
Fig 4.4y
PREVIOUS AND NEXT At the top-right and bottom-right corners, you see information about the number of pages. All the page numbers represent buttons for each page. By clicking on any page number, the software takes you to that particular page. Click on the “NEXT” button to take you to the next page. Click on the “PREVIOUS” button to navigate to the previous page.
DISMISS To close this page, click on the “DISMISS” button at the bottom-right corner of the page.
Back to fig. 4.4i – PEP Repository list page: At the end of each report row, the software indicates whether the report processing is enabled or disabled under the ‘ACTIVE’ column.
For reports that have been completed, their status will read ‘ENABLED’. See fig. 4.4i for an instance.
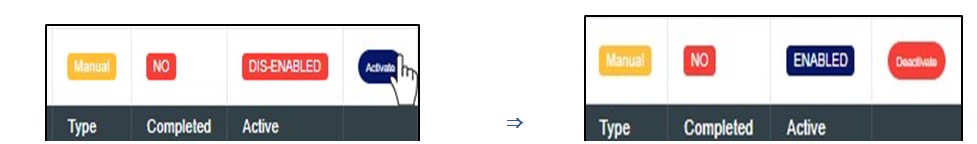
For reports that have not been completed, and whose status reads ‘DIS-ENABLED’, there will be an extra button next to their ACTIVE status. This button is used to “ACTIVATE” or “DEACTIVATE” the processing of the report.
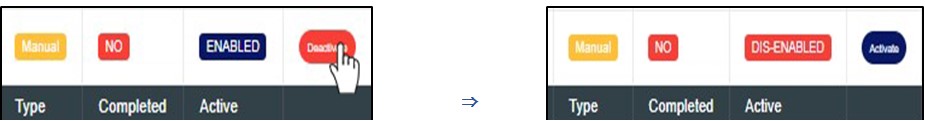
See Fig. 4.4z below for an example. The button turns red when the report is enabled, and it can be used to DEACTIVATE the report. It is yellow when the report is disabled, and it can be used to ACTIVATE the report for processing.
NOTE: Only person(s) assigned the right to ‘view PEP Report’ and ‘Edit PEP Report’ can carry out these operations.
Fig 4.4z
As in Fig. 4.4z above, the second report has not been completed. Click on “Activate” to enable processing of the report or “Deactivate” to disable the report.
Click on “ACTIVATE” to turns the status bar of the report to green with an ‘ENABLED’ inscription, while clicking on “DEACTIVATE” will turn the status bar back to red with an ‘DIS-ENABLED’ inscription. See Fig. 4.4aa and Fig. 4.4ab to see the result of activating the report for an example, and see Fig. 4.4ac and Fig. 4.4ad to see the result of deactivating the report for another example.
At the top and end of the page, the software gives information about the number of pages of your result, with the page numbers written out. All the page numbers represent buttons for each page. By clicking on any page number, the software takes you to that particular page. There is the “NEXT” button to take you to the next page when you click on it, and there is a “PREVIOUS” button to take you to the page before the one you are viewing at that moment. See these features in Fig. 4.4ae below.
Here, the software can generate graphs with the value and/or volume of transactions plotted against the time or period in which they occur. To get the planet to give you an analysis of any ADRAPS FTR type over a period of time, here is how to go about it.
NOTE: Only person(s) assigned right(s) to ‘process FTR Reports’ will be able to carry out this Operation.
STEP 1: From the left hand side menu, Click on ‘REPORTS’ as shown below
This will display a drop down . The dropdown lists the report types available on the compliance planet software.
STEP 2: Click ‘CBN ADRAPS FTR’ on the drop down list. See an example below.
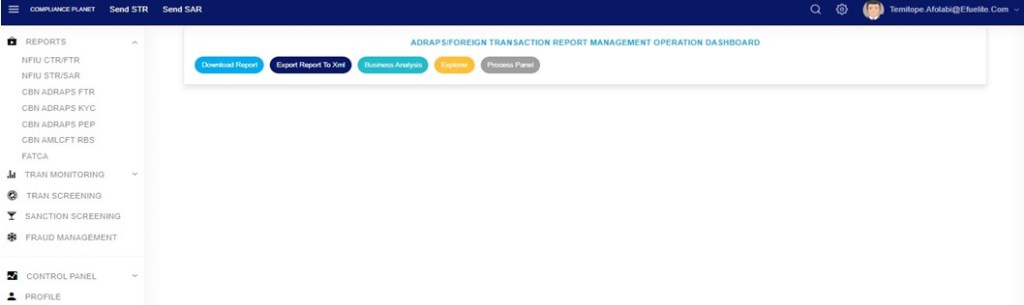
This will display the ADRAPS FTR page as shown below
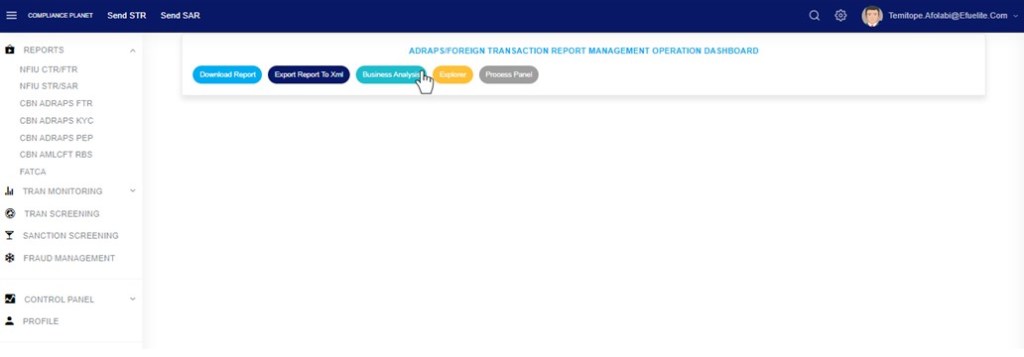
STEP 3: From the Top menu, click “Business Analysis” as shown in fig 3.6a below
(fig. 3.6a)
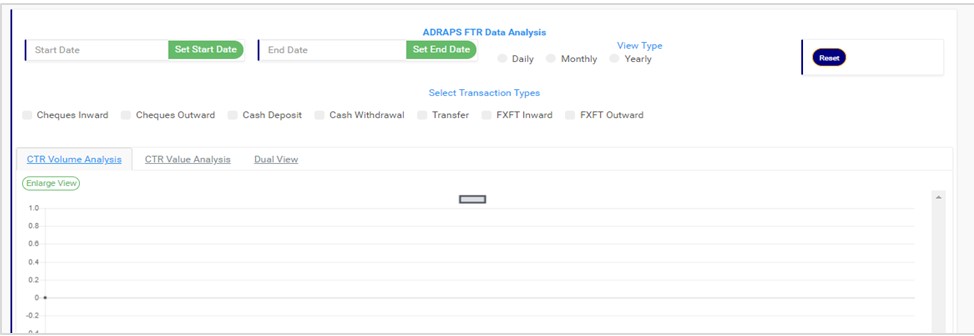
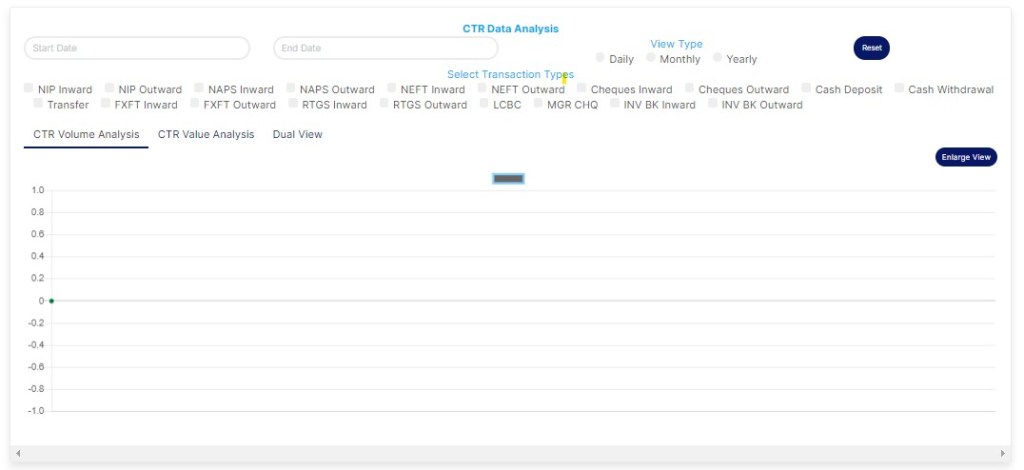
This displays a page as in fig. 3.6b below.
(fig. 3.6b)
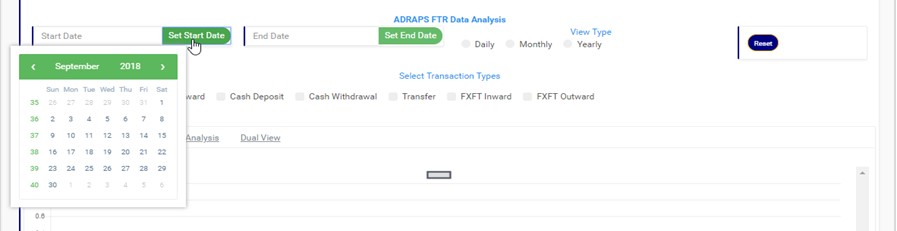
STEP 4: Click on SET START DATE and SET END DATE to specify the beginning and the end of the period the analysis will cover. You must set your date parameters before selecting any transaction type for analysis. Take a look at fig. 3.6c to see how to set the date. Fig. 3.6d shows a labelled calendar next.
(fig. 3.6c)
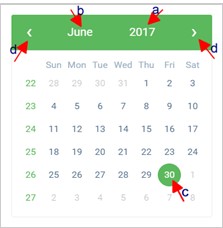
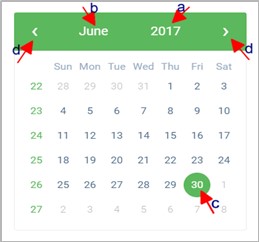
Take a look at the arrows labelled a to d in fig. 3.6d to study the calendar.
Click on the given year to change it to your year of choice.
Click on the given month to change it to your month of choice.
Then, click on the date of the month.
You can also click on the angle brackets on the calendar [ ‘<’ or ‘>’ ] to go backward or forward.
(fig. 3.6d)
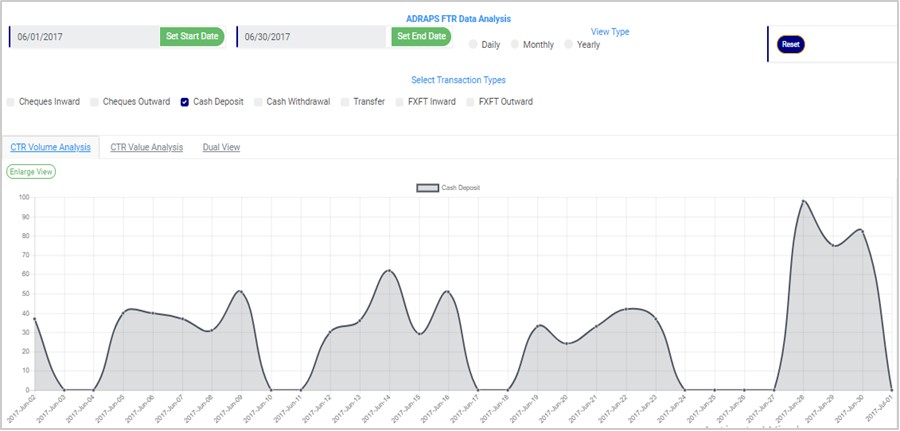
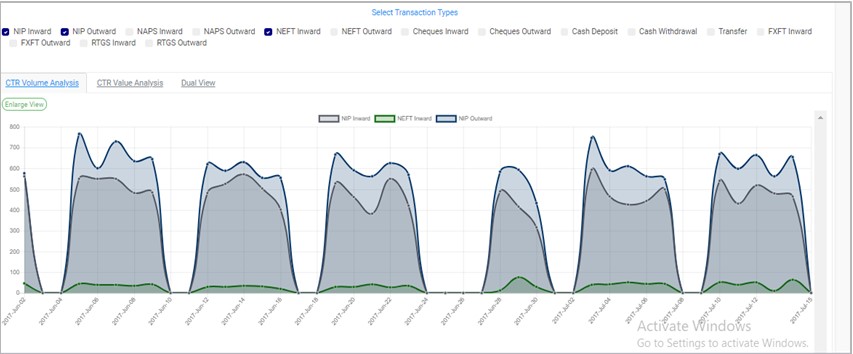
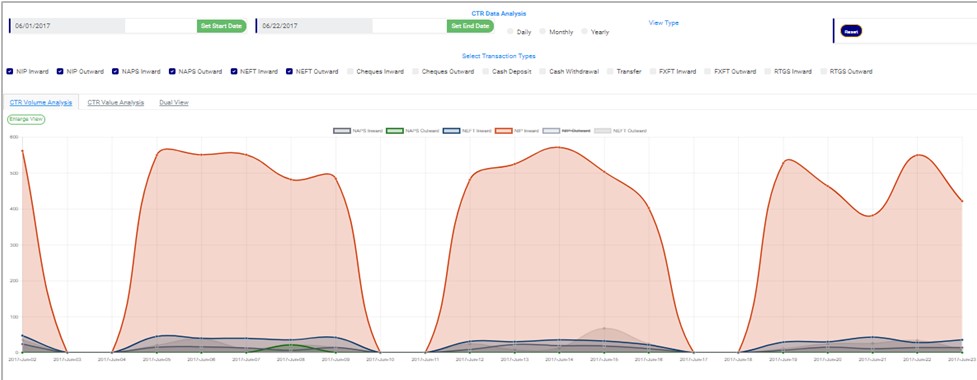
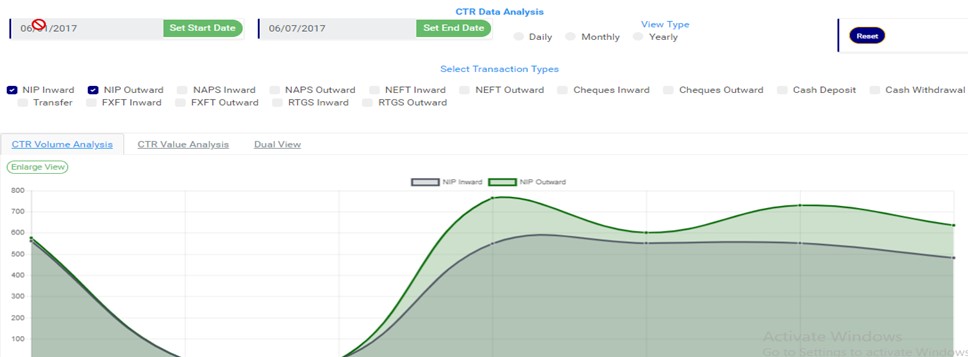
STEP 5: Tick the checkbox ◻ of the FTR type(s) you want to view. As soon as you select a transaction type, the software processes it and displays a graph instantly. Fig. 3.6e below is an example for Cash Deposit ADRAPS FTR for 1st of June, 2017 to 30th of June, 2016.
(fig. 3.6e)
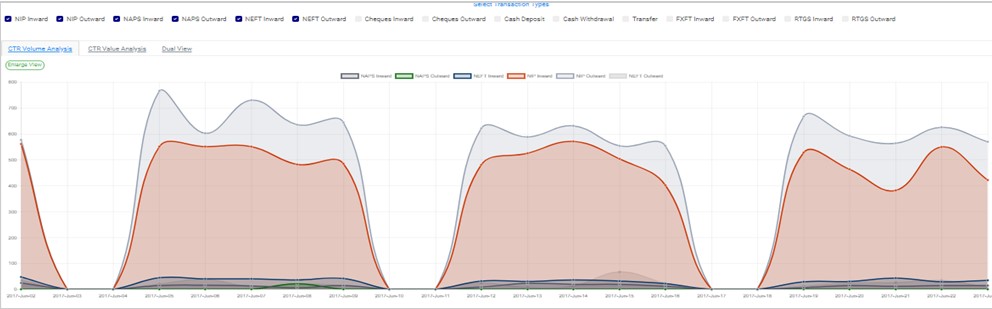
More than one transaction can be selected. You can select all if you wish. See fig. 3.6f below for an example of graph analysis for more than one transaction.
(fig. 3.6f)
ADRAPS FTRs can be analysed by the volume of the selected transactions or the value of the selected transactions. The Volume analysis is the default analysis you will get anytime you want to analyse any transaction. However, you can view both analysis side by side.
By clicking on the CTR Volume Analysis, the graph analysis will be according to the number of the transactions that occurred in the period you specified in your date settings. Look at fig. 3.6e above for an example.
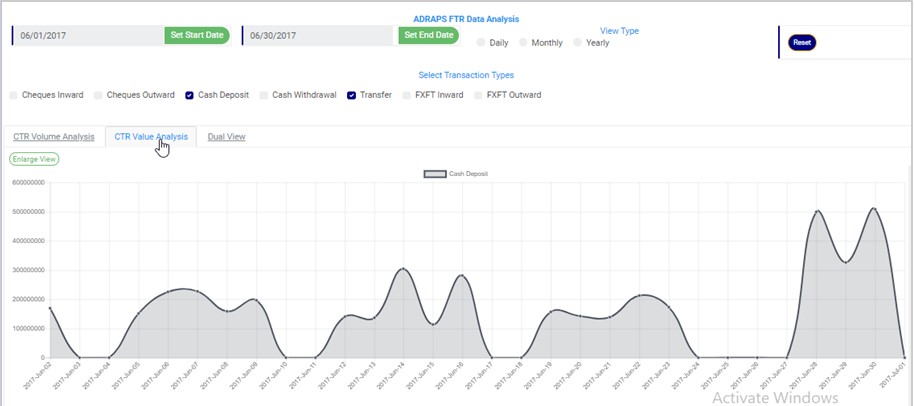
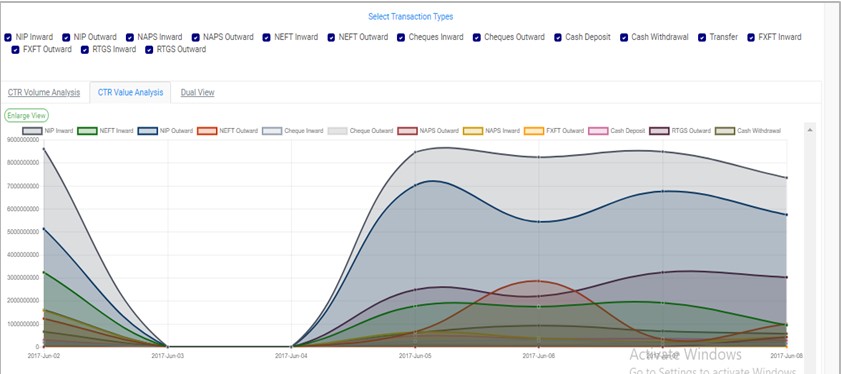
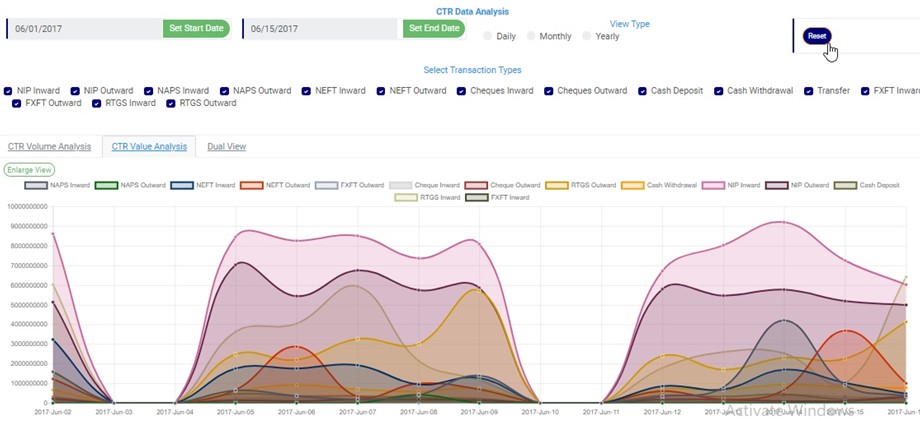
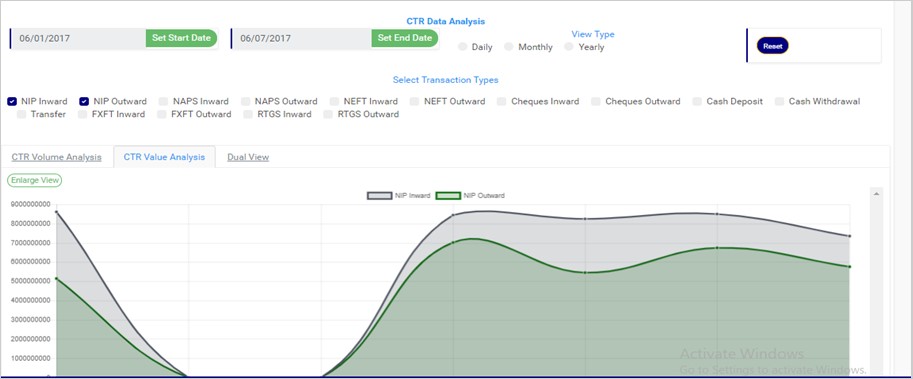
By clicking on the CTR Value Analysis, the graph analysis will be according to the amounts (in naira) of the transactions that occurred in the period you specified in your date settings. Look at fig. 3.6g below for an example on value analysis.
(fig. 3.6g)
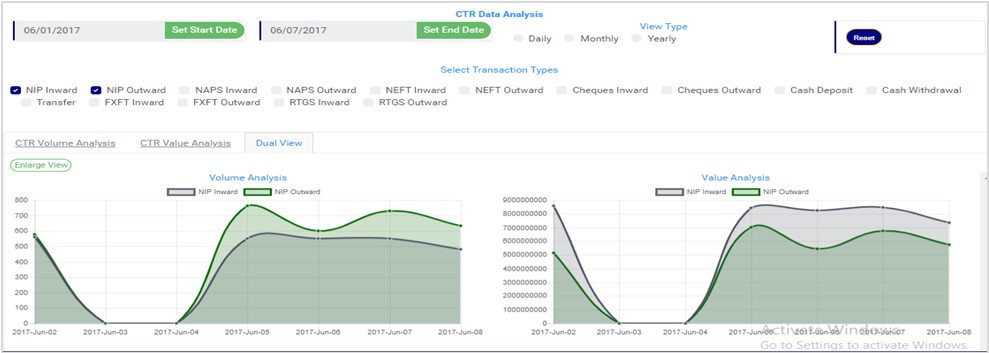
By clicking on the Dual View, the planet places both analysis, that is both volume and value, side by side. See an example of a dual view in fig. 3.6h.
(fig. 3.6h)
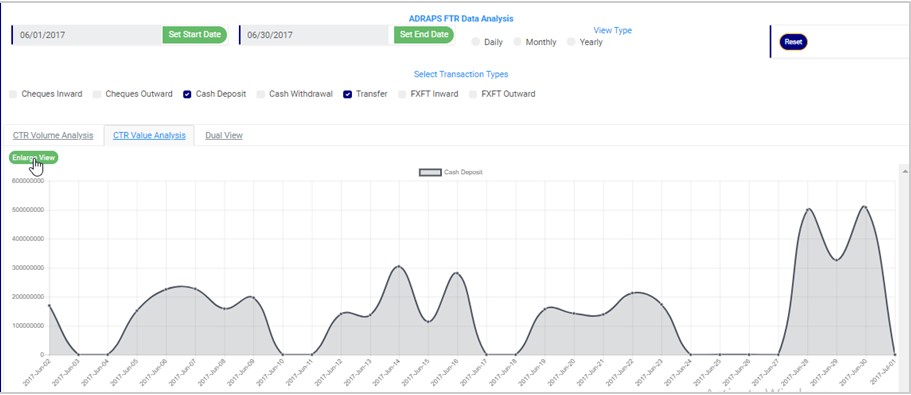
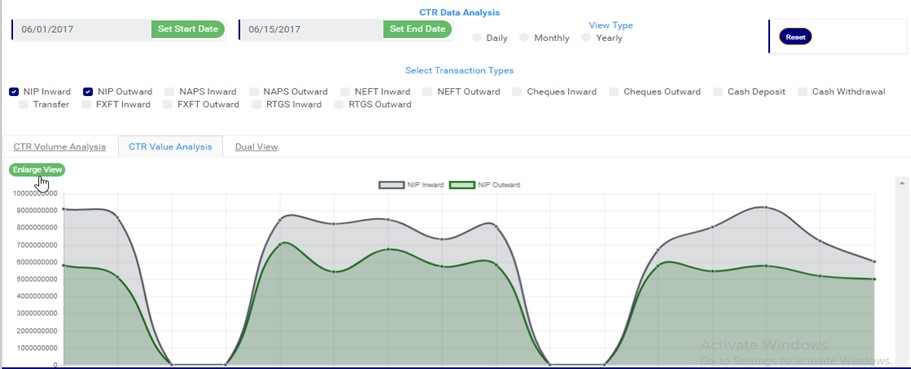
To see a bigger view of your graph, click on the ENLARGE button. Check out fig. 3.6i to see the button.
(fig. 3.6i)
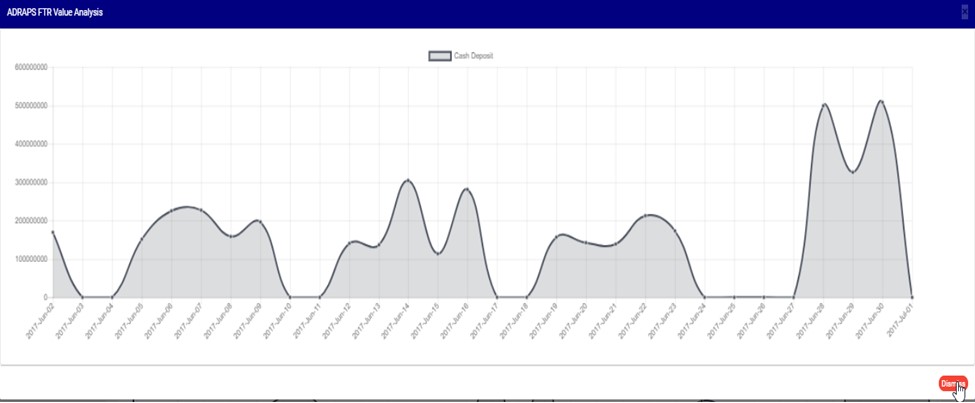
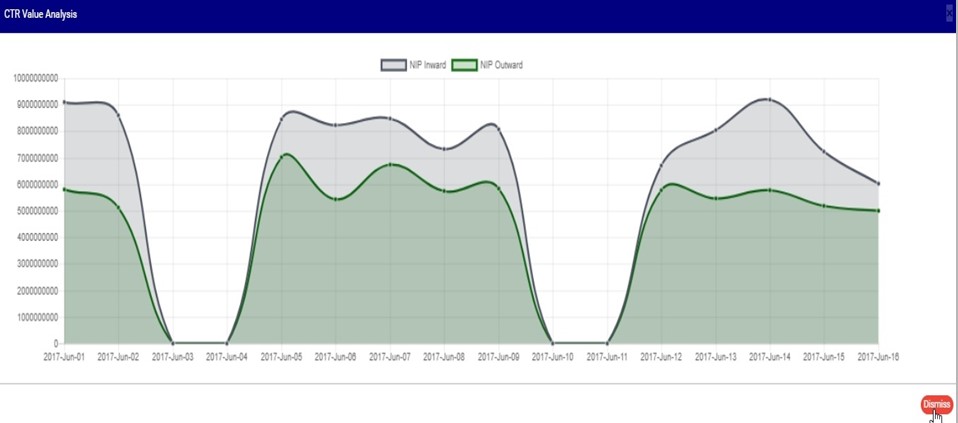
See fig. 3.6j and fig. 3.6k for an enlarged view of a graph (one analysis) and an enlarged view of two graphs together (dual view of the value and volume analysis) respectively.
(fig. 3.6j)
(fig. 3.6k)
There is a red button at the bottom-right corner of the graph console. It is the DISMISS button for closing the console. Click on it as in fig. 3.6k above and the enlarged view will be closed.
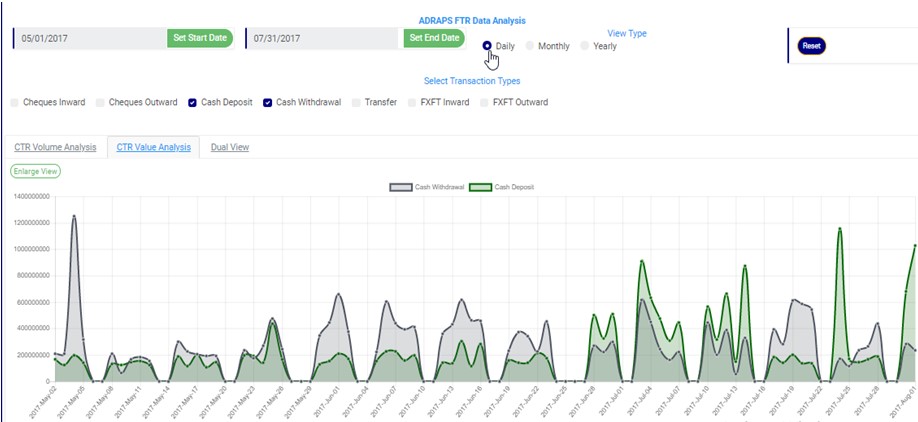
STEP 6: Click on DAILY or MONTHLY or YEARLY to change parameter of the time or period. You can switch these view options to see analyses differently. These buttons are next to the End Date button on the page. See fig. 3.6l below to view them.
(fig. 3.6l)
By clicking Daily, the value or volume of the transaction type is plotted against each day within the period specified in the date settings. This is the default view setting on the planet for every analysis.
By clicking Monthly, the value or volume of the transaction type is plotted against each month within the period specified in the date settings. This will have effect on analyses with date settings that spread to two or more months.
By clicking yearly, the value or volume of the transaction type is plotted against each year within the period specified in the date settings. This feature will have effect if the period specified in your date settings spreads to two or more years.
Once you select any start date, end date and you mark any transaction for analysis, the software processes the details of the transaction selected right away, so, you cannot undo any setting you have made. You can only switch between volume and value analysis and change your view type. To make new settings for a fresh analysis, click on the RESET button. The software will wipe off all your previous selections. See fig. 3.6l below to view the Reset button. It is next to the View Type buttons
The Compliance Planet software can help you with graphs with the volume and/or value of transactions plotted against the time or period in which they occur. Thus, making financial reporting easier. To get the analysis of any transaction type over a period of time, here is how to go about it.
NOTE: Only person(s) Assigned right(s) to ‘process CTR reports’ will be able to carry out this Operation.
From the left hand side menu, Click on ‘REPORTS’ as shown below
This will display a drop down as shown below. The drop down lists the report types available on the compliance planet software.
Click ‘NFIU CTR/FTR’ on the drop down list. See an example below.
This will display the NFIU CTR/FTR page
STEP 1: From the top menu , Click “Business Analysis” as in Fig 2.5a below
This displays a page as shown in Fig 2.5b below
(fig. 2.5b)
STEP 3: Click on SET START DATE and SET END DATE to specify the beginning and the end of the period (respectively) for which you want to see. You must set your date parameters before selecting any transaction type for analysis.
(fig. 2.5c)
Take a look at the arrows labelled a to d in fig. 2.5d to study the calendar.
Click on the given year to change it to your year of choice.
Click on the given month to change it to your month of choice.
Then, click on the date of the month.
You can also click on the angle brackets on the calendar [ ‘<’ or ‘>’ ] to go backward or forward.
(fig. 2.5d)
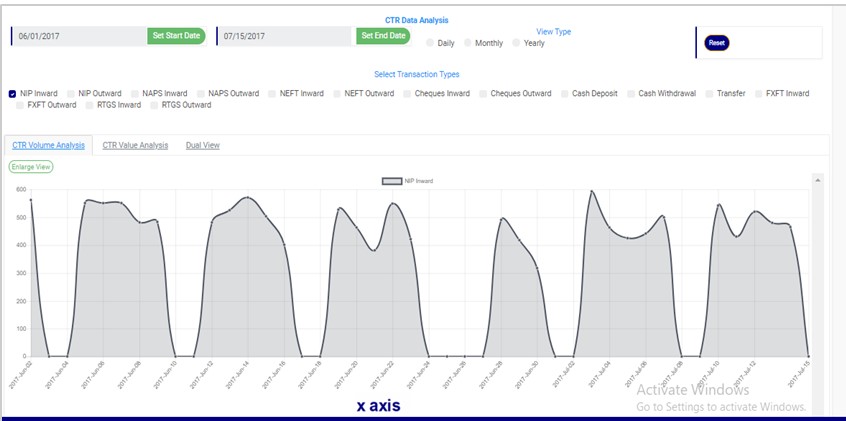
STEP 4: Tick the checkbox ◻ of the transaction type(s) you want to view. As soon as you select a transaction type, the software processes it and immediately displays a graph . Fig. 2.5e below is an example for NIP Inward transaction for 1st of June, 2017 to 15th of June, 2016.
(fig. 2.5e – one transaction type graph)
Looking at fig. 2.5e above, the time or periods are always labelled on the x axis (horizontal axis) and the volume or values of the transactions are always on the y axis (vertical axis). So, from the example in the fig. 2.5e, about 500 to 600 ‘NIP Inward’ reporting threshold transactions occurred on the 2nd of June, 2017.
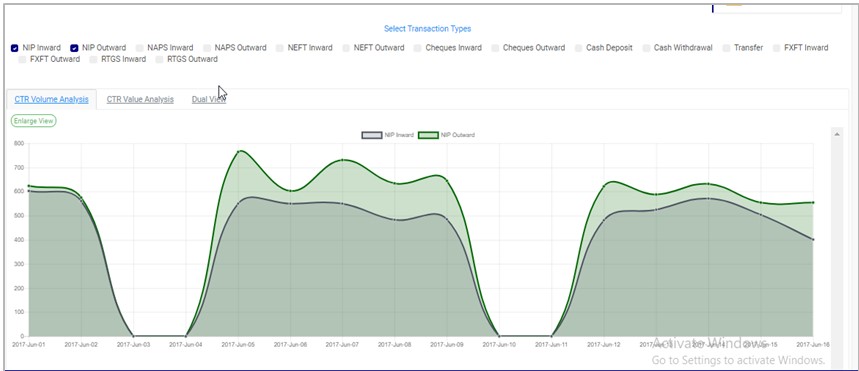
You can see analysis for more than one transaction type. See fig 2.5f and 2.5g to see the analysis for two (2) and three (3) transactions types at the same time on the same graph respectively.
Two-Transaction Type Graph:
(fig. 2.5f – two-transaction type graph)
Three-Transaction Type Graph:
(fig. 2.5g – three-transaction type graph)
You can check all the boxes if you want to see analysis for all. See fig. 2.5h below to see an example.
(fig. 2.5h – All transactions analysed on the same graph)
You can switch to a larger view of your graph by clicking on the ‘Enlarge View’ button. This button is at the top-left side of the graph, above the selected transaction types. Check fig 2.5i and fig. 2.5j to see the Enlarge button and the Enlarged view of the graph respectively.
(fig. 2.5i)
An enlarged view of the graph:
(fig. 2.5j)
From the fig. 2.5j above, you can see a red button at the bottom-right of the console. It is the DISMISS button to close the enlarged view of the graph. By clicking it, you will be led back to the transaction analysis page as that in fig. 2.5i.
Once you set your start and end dates and select transaction type, you cannot change the date settings by going straight back to the calendar or deselect any transaction type by unchecking its box. You have to click on the Reset button. Check out fig. 2.5k to see the reset button at the top right area of the transaction analysis page.
(fig. 2.5k)
As seen in fig. 2.5e, fig. 2.5f, fig. 2.5g, fig. 2.5h, fig. 2.5i, fig. 2.5j and fig. 2.5k, names of the selected transaction types appear with coloured rectangular buttons before each of them. The colours differs from one transaction type to another. The colour of the button before each transaction type represents the colour of the transaction type line on the graph. These coloured buttons appear right above the graph both in the enlarged or normal view.
To hide transactions line on the graph, click on the box just before the name of the transaction type(s) you want to hide and click the box again to re-select. See fig 2.5l and 2.5m to see a graph before hiding one of the transactions and after hiding the transaction type
(fig. 2.5l)
(fig. 2.5m)
STEP 5: Click on DAILY or MONTHLY or YEARLY to change parameter of the time or period. You can switch these view options to see analyses differently. These buttons reset the parameters on the x axis.
By clicking Daily, the value or volume of the transaction type is plotted against each day within the period you specify in your date settings. The default view type is ‘DAILY’.
By clicking Monthly, the value or volume of the transaction type is plotted against each month within the period you specified in your date settings. This will have effect on analyses with date settings that spread to two or more months.
By clicking Yearly, the value or volume of the transaction type is plotted against each year within the period you specified in your date settings . This feature will have effect if the period specified in your date settings spreads to two or more years.
STEP 6: Click on CTR Volume Analysisor CTR Value Analysis or Dual Viewto see analysis based on volume of transactions or value of transactions or value and volume together. The volume analysis button and the value analysis button only change parameters on the y axis to number or amounts.
By clicking on the CTR Volume Analysis, the graph analysis will be according to the number of the transactions that occurred in the period you specified in your date settings. Look at fig. 2.5n below for an example on NIP Inward volume analysis.
(fig. 2.5n)
By clicking on the CTR Value Analysis, the graph analysis will be according to the amounts (in naira) of the transactions that occurred in the period you specified in your date settings. Look at fig. 2.5o below for an example on NIP Inward value analysis.
(fig. 2.5o)
By clicking on the Dual View, the software places both analysis, i.e. volume and value, side by side.
XML stands for Extensible Mark-up Language. It is a markup language that defines a set of rules for encoding documents in a format that is both human-readable and machine-readable. It is a metalanguage which allows users to define their own customized markup language, especially in a way to display documents on the internet. It was designed to store, transport and describe data. It is a flexible way to create information formats and electronically share structured data via both public and corporate networks. The software generates XML from CTR FTR exported Transaction and Account Excel files. Here is how to go about it.
NOTE: Only person(s) Assigned right(s) to ‘process CTR reports’ will be able to carry out this Operation.
From the app dashboard, click on “REGULATORY REPORTS” as shown below
Click ‘NFIU CTR/FTR’ on the drop-down list. See an example in Fig below. This will display the NFIU CTR/FTR page.
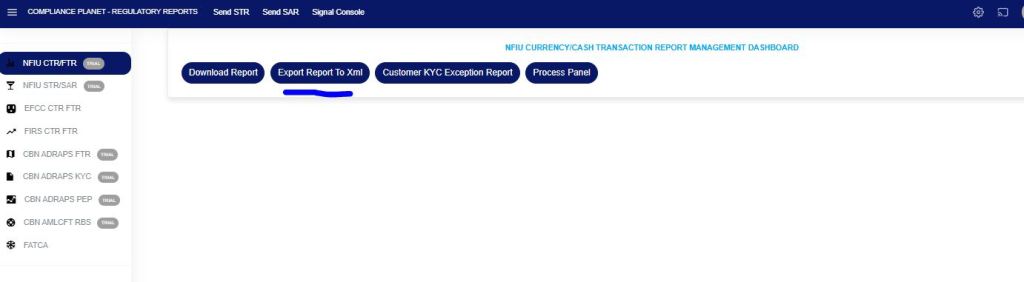
STEP 1: From the menu, Click “Export Report to XML” as in Fig 2.4a below.
Fig 2.4a
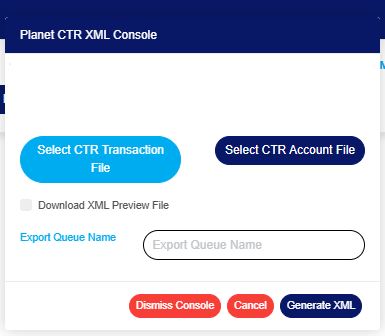
This displays a planet CTR XML console as in Fig 2.4b below
Fig 2.4b
STEP 2: Click on “SELECT CTR TRANSACTION FILE“ to upload the Excel file containing the transaction details, from your computer.
Fig 2.4c
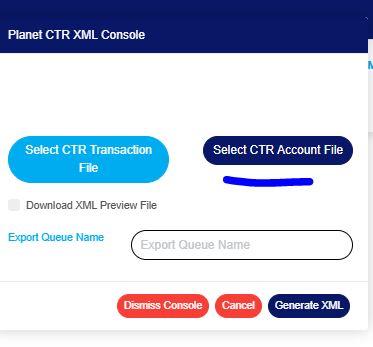
STEP 3: Click “SELECT CTR ACCOUNT FILE“to upload the Excel file containing the account details, from your computer.
Fig 2.4d
NOTE: The two files are required to generate a CTR FTR XML file; CTR TRANSACTION FILE and CTR ACCOUNT FILE. Both files must be uploaded. None is optional
STEP 4: Click “Export Queue Name” text box to set the name of the document. See this in Fig. 2.4e.
Fig. 2.4e
STEP 5: Tick ‘Download XML Preview File’ to generate and download XML Preview file. See the button in fig. 2.4f below.
Fig. 2.4f
STEP 4: Click on ‘GENERATE XML’. This button is the blue button at the bottom-right corner of the XML console as in Fig.2.4g below.
Fig. 2.4g
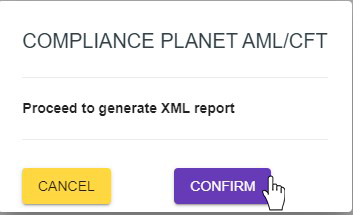
A confirmation console will be displayed as in Fig. 2.4h below
Fig 2.4h
An Upload report file will be downloaded on your computer at the end of the upload. This file will provide information about the number of transactions extracted, transactions generated, transactions not generated, number of files generated and the file name.
When the operation is complete, you can open the XML files.
XML stands for Extensible Markup Language. It is a markup language that defines a set of rules for encoding documents in a format that is both human-readable and machine-readable. It is a metalanguage that allows users to define their own customized markup language, particularly for displaying documents on the internet. It was designed to store, transport, and describe data. It is a flexible way to create information formats and electronically share structured data via both public and corporate networks.
NOTE: Only person(s) Assigned right(s) to ‘Process FTR’ reports will be able to carry out this Operation.
The software can help you generate XML files from Excel. Here’s how to proceed.
Step 1: From the app dashboard, click on “REGULATORY REPORTS” as in Fig. 3.5a below.
Fig 3.5a
Step 2: Click on “CBN ADRAPS FTR” in the drop-down list, and this displays the ADRAPS FTR page, as shown in Fig. 3.5b below.
Fig 3.5b
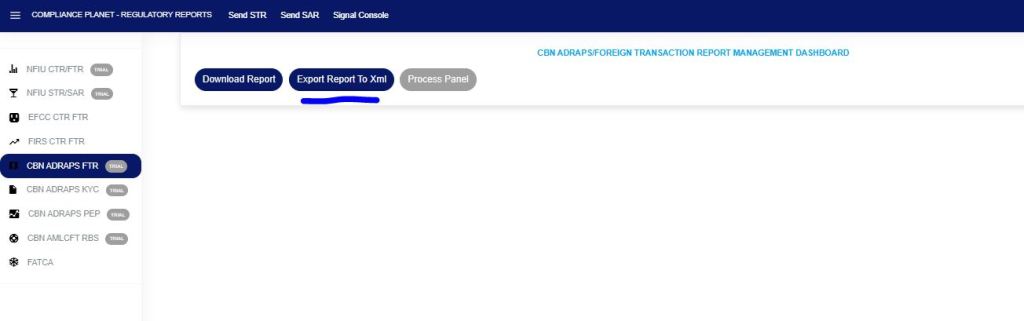
Step 3: From the menu, click “Export Report to XML” as in Fig. 3.5c below.
Fig 3.5c
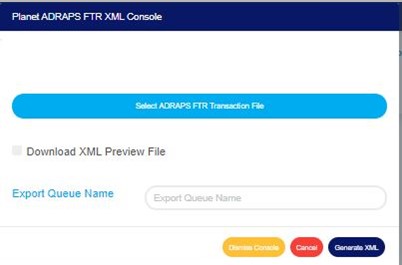
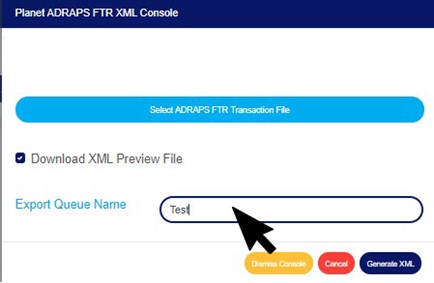
A ‘Planet ADRAPS FTR XML Console’ as in Fig. 3.5d below will be displayed.
Fig 3.5d
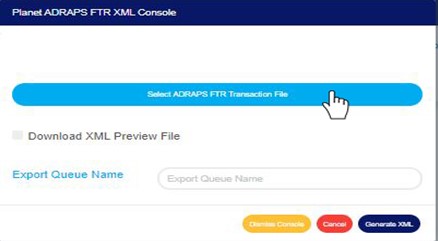
Step 4: Click on ‘Select ADRAPS FTR Transaction File’ to upload an ADRAPS FTR file from your computer, as in Fig. 3.5e. The information in the uploaded file is what Compliance Planet will convert into an XML file. See how to upload a file from your computer.
Note: if you are uploading a transaction file downloaded from the Compliance Planet, you must
Unlock the Excel file; to do this, open the Excel file and click “enable editing” in the Excel editor.
Delete the S/N column in the Excel file to be uploaded.
Fig 3.5e
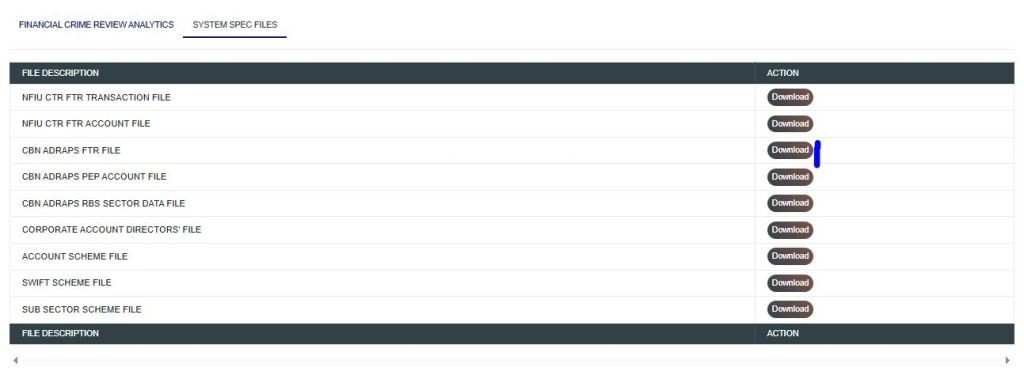
If you do not have the file specification for uploading the ADRAPS FTR transaction, you can download it from the “SYSTEM DATA SPEC FILES” on the software.
Go to the Regulatory Report page and click “SYSTEM DATA SPEC FILES” as shown below.
Click the download button associated with the report type, as shown below.
An Excel file will be downloaded to your computer with pre-filled titled columns under which the details will be entered. Open the file, fill in the required details of the ADRAPS FTR account data, and save the changes. Renaming the file on your computer is optional. Go back to the software and click on ‘Select ADRAPS FTR Transaction File’ to select the file.
The file must be unlocked in the Excel editor by clicking enable editing, and data must be filled in, as the software will not process an empty file.
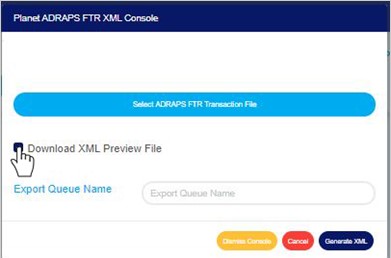
Step 5: Tick ‘Download XML Preview File’ to download the XML preview file. This preview file provides a numerical download report on the XML file generated, including the total number of transactions XML generated, the total number of transactions not generated, and the number of transactions extracted from the ADRAPS file uploaded. It also gives details of transactions with missing information. It is in Excel format. See Fig. 3.5f to see the checkbox.
Fig 3.5f
Step 6: Click on the ‘Export Queue Name’ textbox to set the file name. See an example in Fig. 3.5g below.
Fig 3.5g
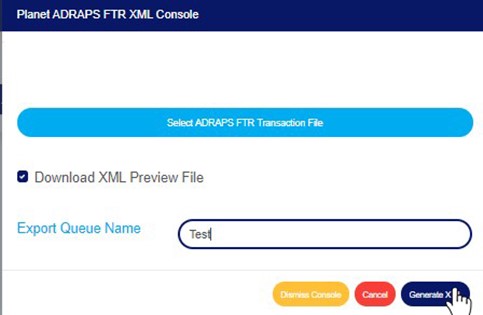
Step 7: Click on “GENERATE XML“. Refer to Fig. 3.5h below to locate the blue button at the bottom-right corner of the console.
Fig 3.5h
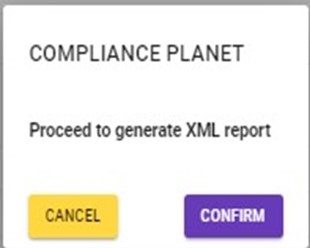
This displays a confirmation console as in Fig. 3.5i below.
Fig 3.5i
To make changes to your report settings on the ADRAPS FTR Console, click on Cancel. This will take you back to the ADRAPS FTR XML Console.
Click on “CONFIRM “to continue or “CANCEL” to return to the FTR console.
The Signal console shows ongoing processes as in Fig. 3.5j below
Fig 3.5j
Click on the “DISMISS CONSOLE“to close the console.
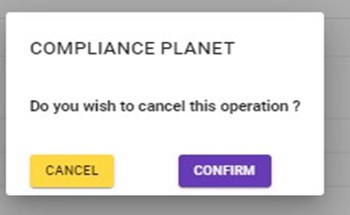
Click on “CANCEL” to stop the operation if you do not want to continue with generating the XML file. A confirmation console as in Fig. 3.5k will be displayed. Click on CONFIRM to confirm that you wish to cancel the operation, or CANCEL to return to the XML Console.
This section provides a guide on how to perform operations pertaining to Manager’s Cheque, with step-by-step instructions and pictures.
NOTE: Only person(s) with right to ‘view MGR CHQ transactions’ can carry out these operations.
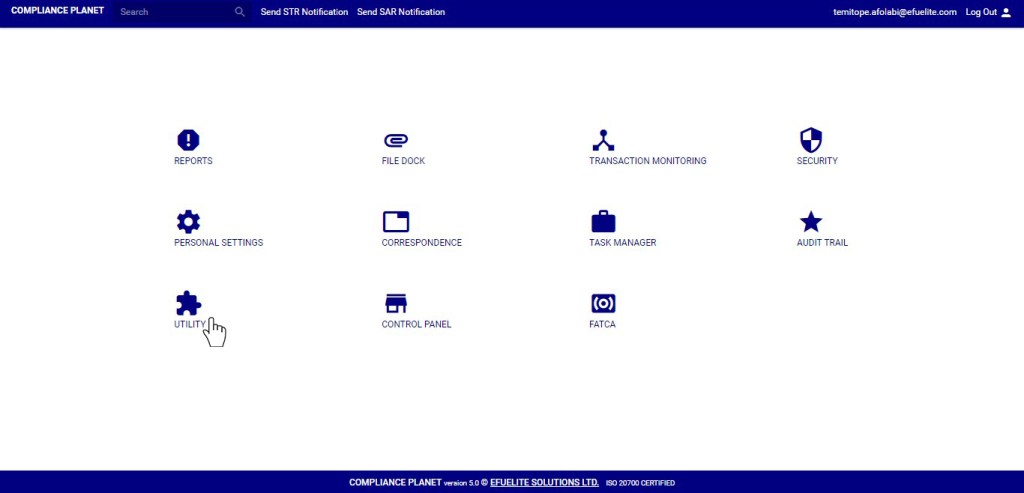
From the main dashboard, click ‘UTILITY’ as in fig 33.0a below
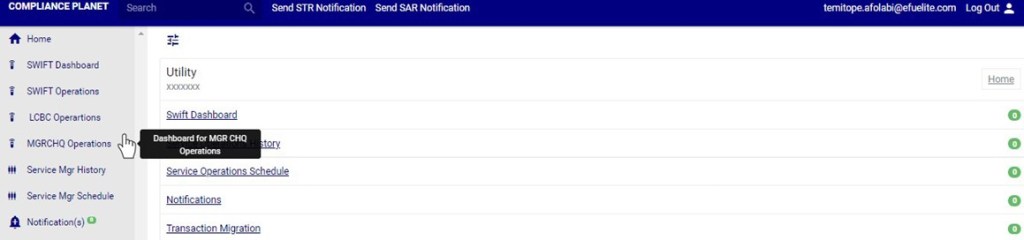
Click on ‘MGRCHQ Operations’ on the left hand side menu as in fig. 33.0b.
(fig. 33.0b)
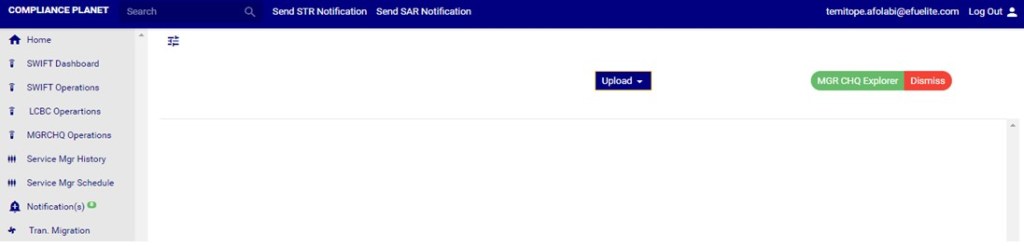
This will display a MGR CHQ operations page as in fig. 33.0c below
(fig. 33.0c)
How to view Manager’s Cheque Transaction Records
NOTE: Only person(s) with right to ‘view MGR CHQ transactions’ can carry out these operations.
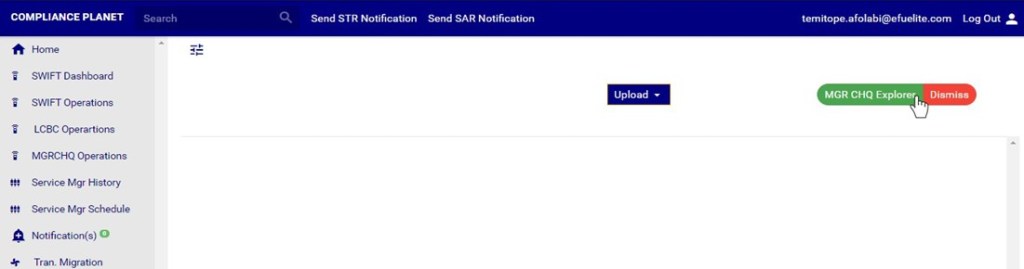
STEP1: Click on ‘MGR CHQExplorer’ button on the Manager’s Cheque Operation page. See Fig 33.2a for an example
(Fig. 33.2a)
This displays a ‘MGR CHQ Explorer’ console as in Fig 33.2b below
(Fig. 33.2b)
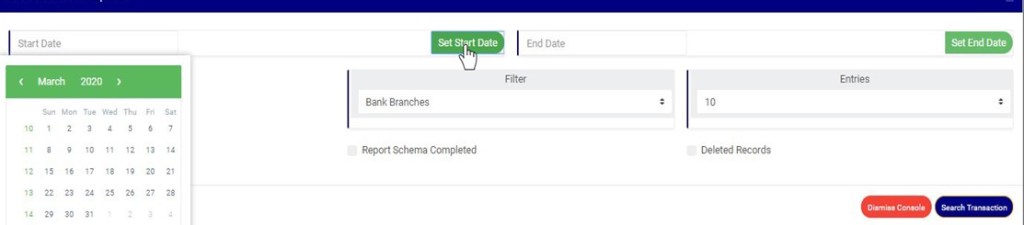
STEP 2: Click on SET START DATE and SET END DATE to specify the date range. See an example in Fig 33.2c below
(fig33.2c)
Take a look at the arrows labelled a to d in fig. 33.2dto study the calendar.
Click on the given year to change it to your year of choice.
Click on the given month to change it to your month of choice.
Then, click on the date of the month.
You can also click on the angle brackets on the calendar [ ‘<’ or ‘>’ ] to go backward or forward.
(fig. 33.2d)
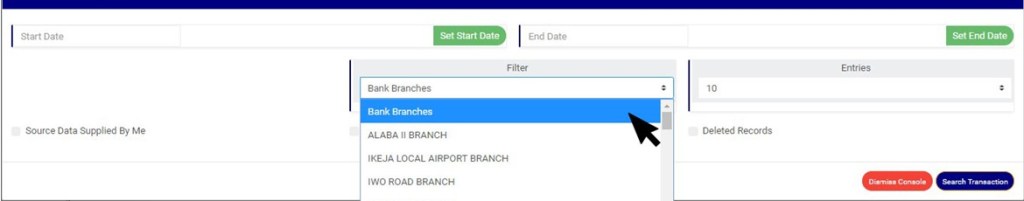
STEP 3: Click on the ‘filter’ box to select a particular bank branch. If you want to see the transactions for all branches, select bank branches. It is the first option on the filter list.
(Fig. 33.2e)
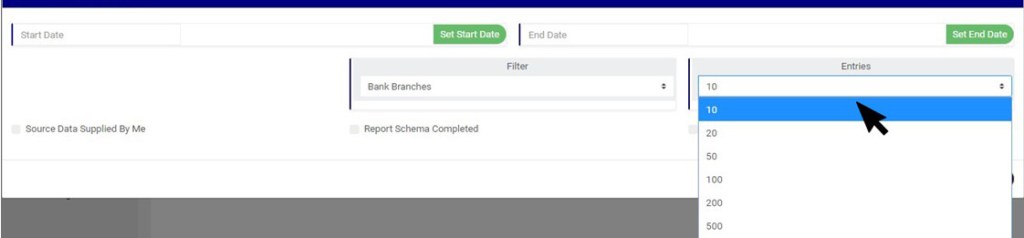
STEP 4: Click on the ‘entries’ box to change the number of transactions you want to see per page. (See the drop-box in fig. 33.2fbelow).
(Fig. 33.2f)
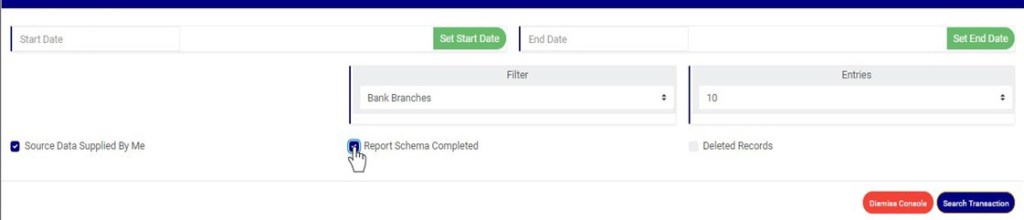
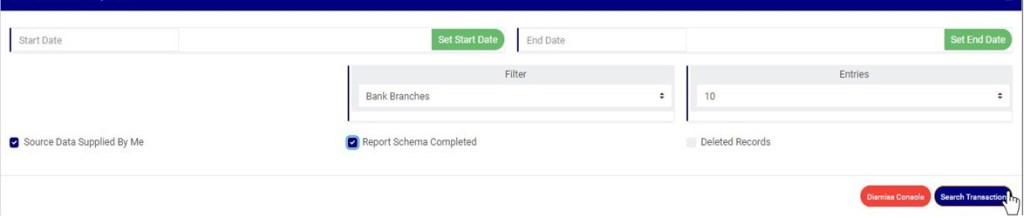
STEP 5: Tick the any of the checkbox as shown in fig 33.2g below to specify the transactions you want to view.
Select ‘Source Data Supplied by Me’ to see list of Manager’s cheque transactions whose source data was supplied by you
Select ‘Report Schema Completed’ to see list of Manager’s cheque transactions whose report schema is complete
Select ‘Deleted Records’ to see list of Manager’s cheque transactions that have been deleted.
(Fig. 33.2g)
NOTE: Leave all checkboxes unchecked to see list of all Manager’s cheque transactions
STEP 6: Click ‘Search Transaction’ as shown in fig 33.2h
(Fig. 33.2h)
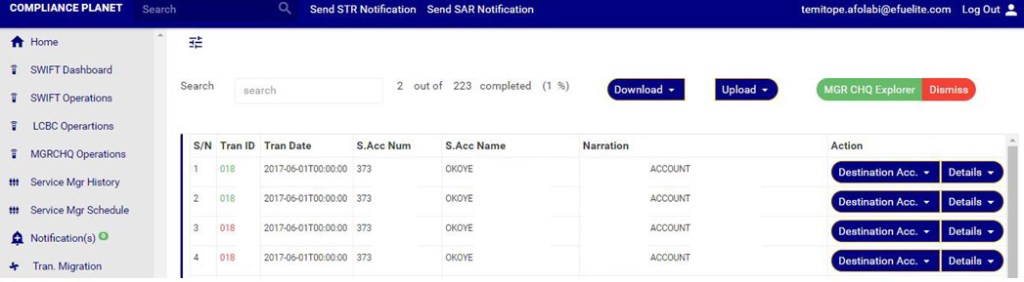
Clicking on the search transaction button will display a page as in Fig 33.2i below
(Fig. 33.2i)
Transactions with transaction ID coloured green shows that the schema for the transaction is complete.
Transactions with transaction ID coloured red shows that the schema for the transaction is incomplete.
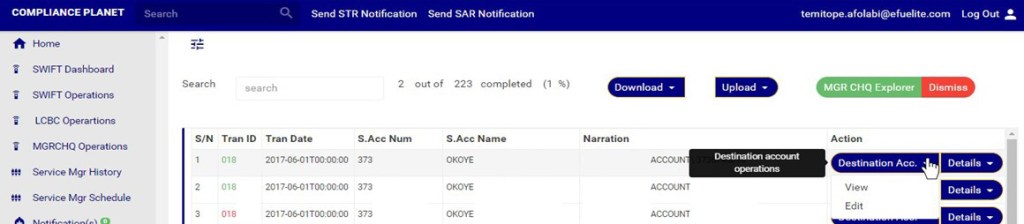
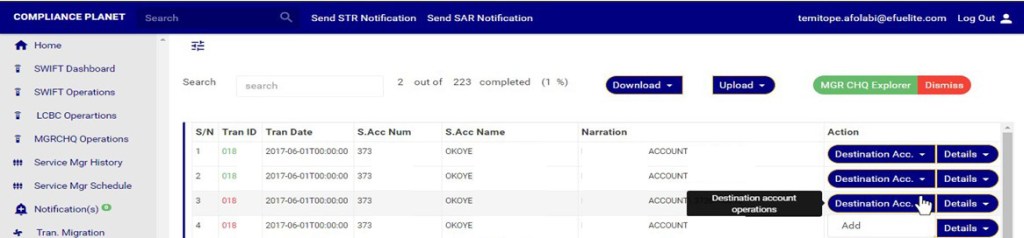
How to carry Out Destination Account Operations on MANAGER’S CHEQUE transaction
Click on ‘Destination Acc.’ button on the Action column, this will display a drop down with option to ‘view’ and ‘Edit’ if the schema for the transaction is complete. However, if the schema is incomplete, the dropdown will have an option to ‘ADD’ new destination account. See an example in fig 33.2j and 33.2k below.
(Fig. 33.2j)
(Fig. 33.2k)
A. How to View and Delete Destination Account Attach to a MANAGER’s CHEQUE Transaction
NOTE: Only person(s) with right to ‘view MGR CHQ transactions’ and ‘Screen Edit MGR CHQ transactions’ can delete destination account data .
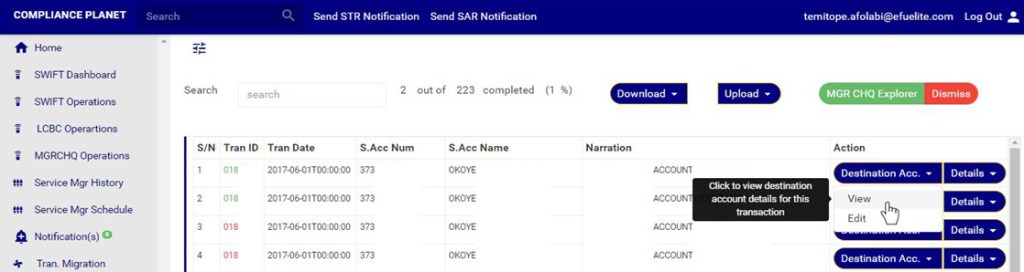
Click on the ‘Destination Acc.’ Button on the action column as in fig 33.2l below. This will display a dropdown
On the destination Acc. Dropdown, click on ‘VIEW’ to see the destination account data for this transaction. As in fig 33.2l below
(Fig 33.2l)
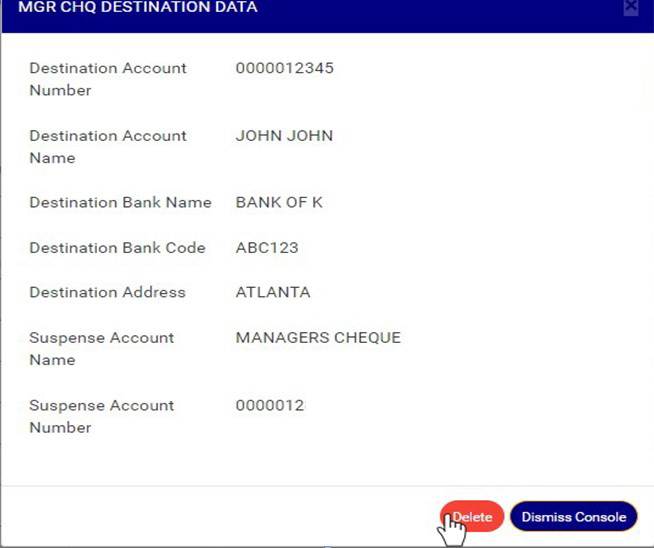
This displays a console as in in fig 33.2m below.
(Fig. 33.2m)
Click on ‘Dismiss console’ to close the console or click ‘Delete’ to delete the destination account data. See fig 33.2n
(Fig. 33.2n)
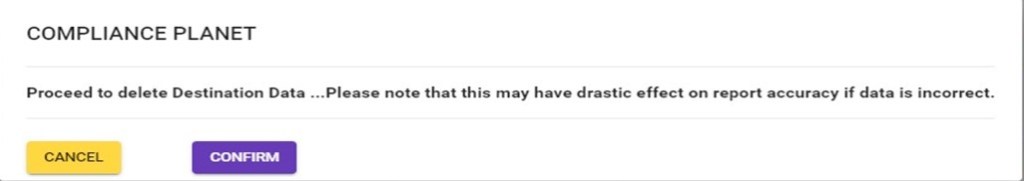
Clicking on delete will display a confirmation console as in Fig 33.2o below. Click confirm to continue or cancel to dismiss the operation.
(Fig. 33.2o)
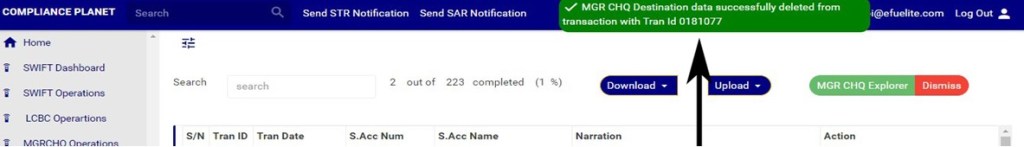
A notification will be displayed at the top of the page when delete is successful. See Fig 33.2p below
(Fig. 33.2p)
B. How to Edit Destination Account Data Attached to a MANAGER’s CHEQUE Transaction
NOTE: Only person(s) with right to ‘view MGR CHQ transactions’ and ‘Screen Edit MGR CHQ transactions’ can carry out these operations.
Click on the ‘Destination Acc.’ Button on the action column as in fig 33.2q below. This will display a dropdown.
On the destination Acc. Dropdown, click on ‘Edit’ to modify Destination account for this transaction. As in fig 33.2q below
(Fig 33.2q)
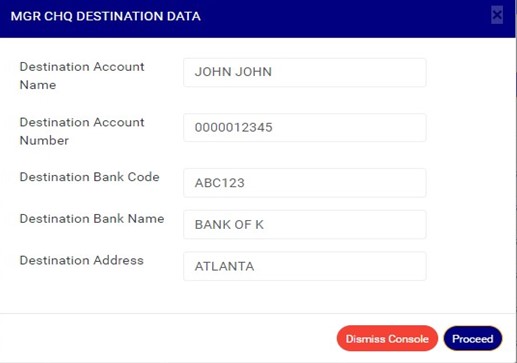
Clicking on ’Edit’ will display a console as in in fig 33.2r below.
(Fig. 33.2r)
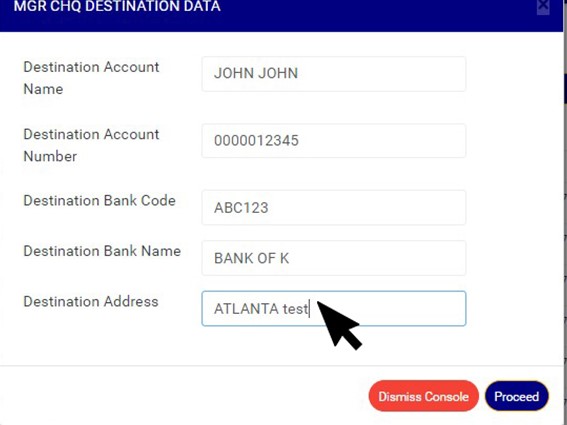
Click on any of the textbox to edit the data as in fig 33.2s below
(Fig 33.2s)
Click on ‘Dismiss console’ to close the console or click ‘proceed’ to save the Destination account data. See fig 33.2t
(Fig. 33.2t)
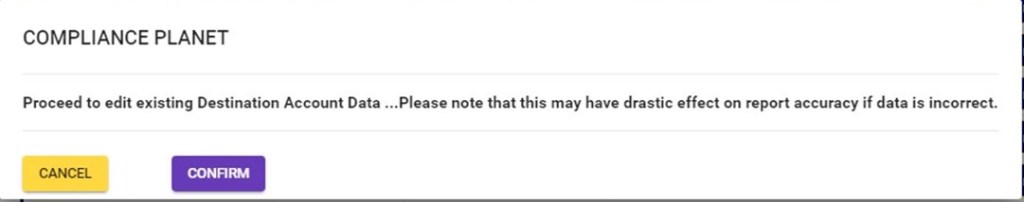
Clicking on proceed will display a confirmation console as in Fig 33.2u below. Click on confirm to continue or cancel to dismiss the operation.
(Fig. 33.2u)
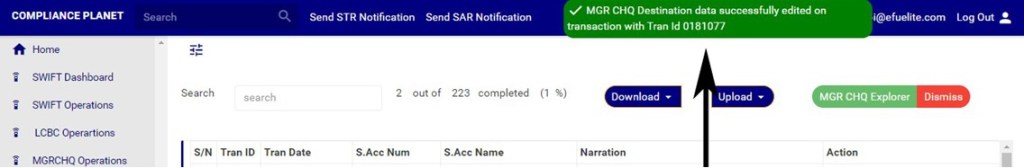
A notification will be displayed at the top of the page when edited destination account data is saved successfully. See Fig 33.2v below
(Fig. 33.2v )
C. How to Add ‘Destination Account’ Data to a MANAGER’s CHEQUE Transaction
NOTE: Only person(s) with right to ‘view MGR CHQ transactions’ and ‘Screen Edit MGR CHQ transactions’ can carry out these operations.
This Option is available when there is no Destination account data attached to the transaction
Click on the ‘Destination Acc.’ Button on the action column as in fig 33.2q below. This will display a dropdown .
On the Destination Acc. Dropdown, click on ‘add’ to add Destination account data to this transaction. This is shown in Fig 33.2w below
(Fig 33.2w)
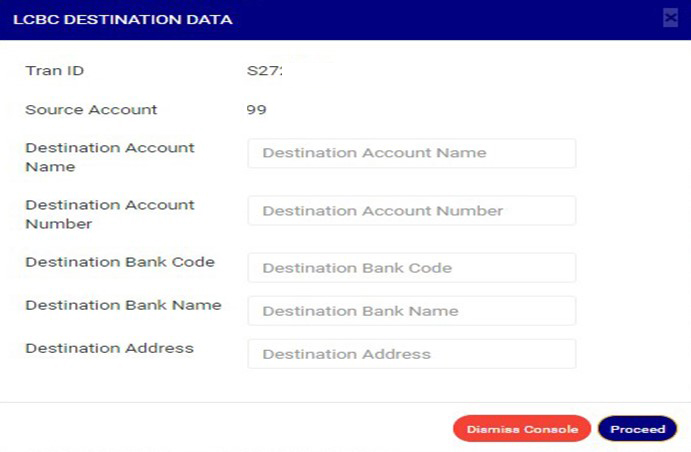
Clicking on ’add’ will display a console as in in fig 33.2x below.
(Fig. 33.2x)
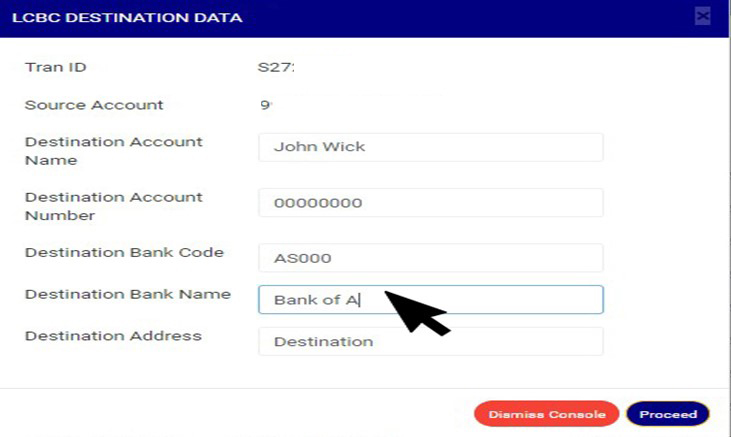
Click on any of the textbox to fill that field as in in fig 33.2y below.
(Fig. 33.2y)
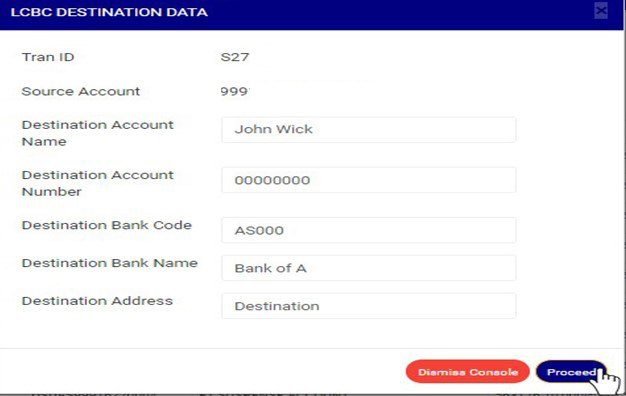
Click on Proceed to add the Destination account data or ‘dismiss console’ to dismiss the operation. See an example in Fig 33.2z below
(Fig. 33.2z)
Clicking on Proceed will display a confirmation console as in Fig 33.2aa below. Click on confirm to continue or cancel to dismiss the operation.
(Fig. 33.2aa)
A notification will be displayed at the top of the page when the destination account data is successfully added. See Fig 33.2ab below
(Fig. 33.2ab)
How to View MANAGER’s CHEQUE ‘Account details’ and ‘Transaction details’
NOTE: Only person(s) with right to ‘view MGR CHQ transactions’ can carry out these operations.
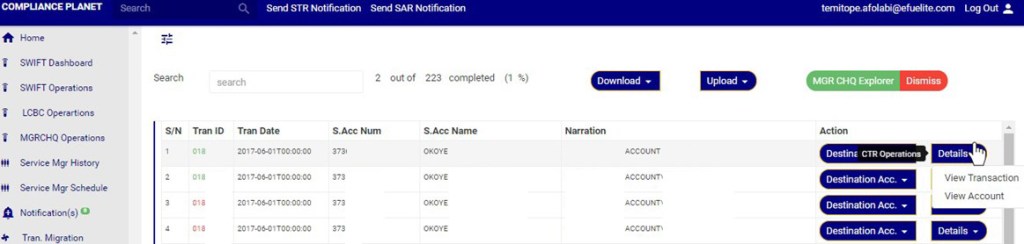
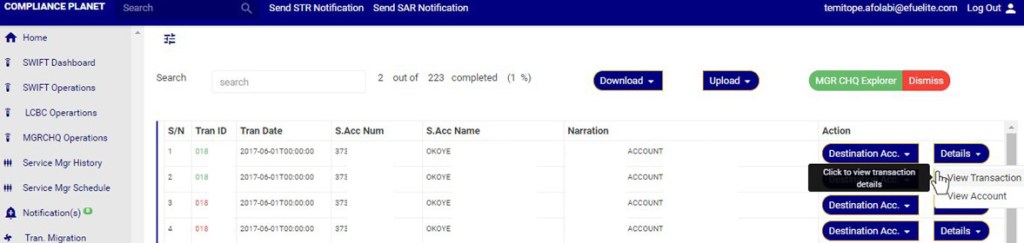
On the MANAGER’s CHEQUE Explorer page, click on ‘Details’ button on the Action column, this will display a drop down with option to ‘VIEW Transaction’ and ’View Account’. See an example in fig 33.2ac
(Fig 33.2ac)
A. How to View MANAGER’s CHEQUE ‘Transaction details’
NOTE: Only person(s) with right to ‘view MGR CHQ transactions’ can carry out these operations.
Click on ‘Details’ button on the Action column, this will display a drop down as in fig 33.2ad
Click on ‘view transaction’ on the dropdown to see the transaction details as in fig 33.2ad below
(Fig 33.2ad)
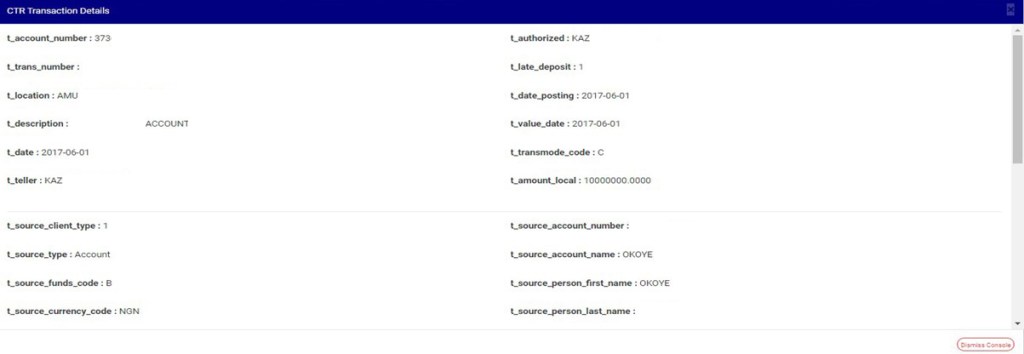
Clicking ‘View Transaction will display a console as in fig 33.2ae below
(Fig 33.2ae)
Click dismiss console to close the console
B. How to view MANAGER’s CHEQUE ‘Account details’
NOTE: Only person(s) with right to ‘view MGR CHQ transactions’ can carry out these operations.
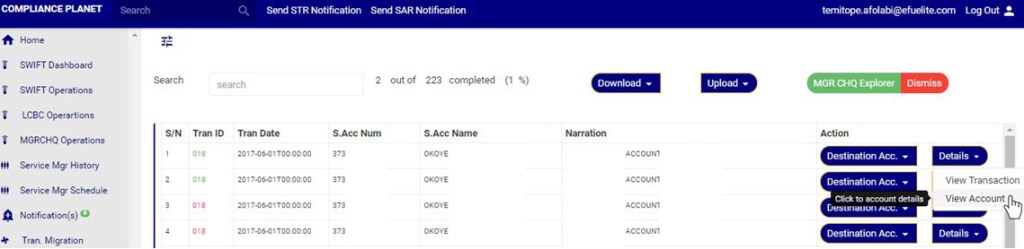
Click ‘Details’ button on the action column, this displays a drop down as in fig 33.2af
Click on ‘view Account’ on the ‘details dropdown’ as in fig 33.2af below to see the Account details
(Fig 33.2af)
Clicking ‘View Account will display a console as in fig 33.2ag below
(Fig 33.2ag)
Click dismiss console to close the console
How to carry out Bulk MANAGER’s CHEQUE transactions Operations
On the MANAGER’s CHEQUE explorer page you can make a bulk download of Manager’s cheque records either for viewing or editing purpose. The process is explained below
A. How to View Bulk MANAGER’s CHEQUE Records
NOTE: Only person(s) with right to ‘view MGR CHQ transactions’ and ‘Download MGR CHQ transactions’ can carry out these operations.
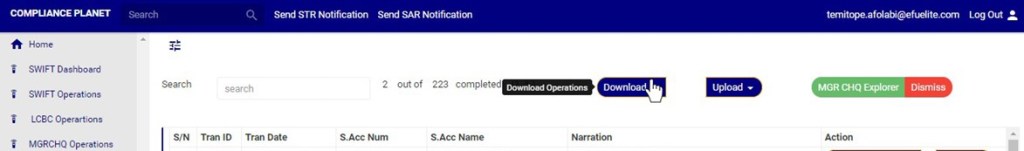
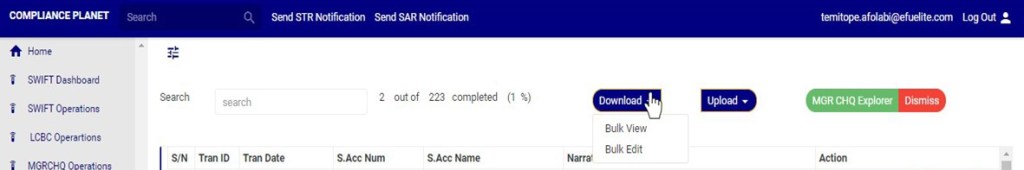
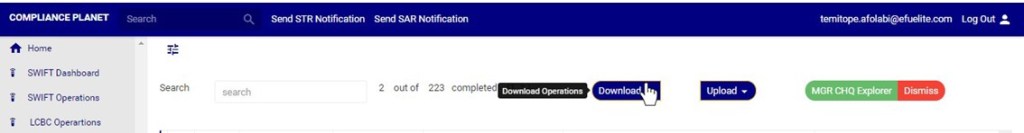
STEP 1: Click on the download button on the MANAGER’s CHEQUE explorer page. See Fig 33.3a for an example
(fig. 33.3a)
Clicking the download button will display a dropdown as in fig. 33.3b below
(fig. 33.3b)
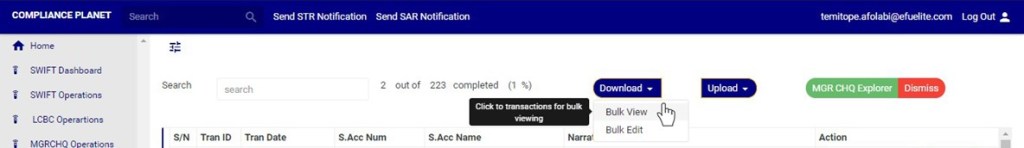
STEP 2: Click on the bulk view as shown in fig 33.3c below
(fig. 33.3c)
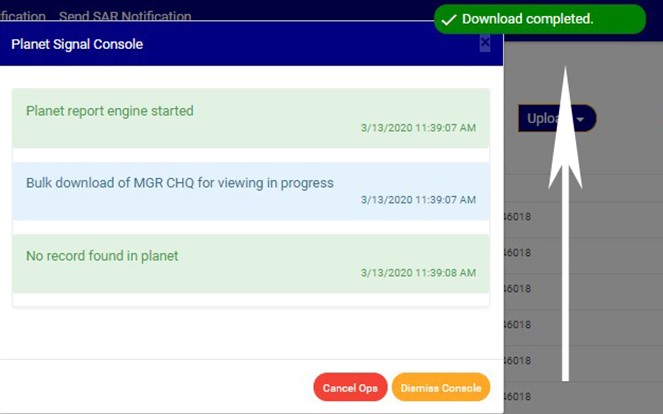
The signal console shows on going processes. An example of a signal console is fig 33.3d. You can terminate unfinished processes by clicking ‘CANCEL OPS’.
To minimize signal console, click on DISMISS CONSOLE.
(fig 33.3d)
An excel file with details of the Manager’s Cheque transactions will be downloaded when the process is complete.
B. How to Edit Bulk MANAGER’s CHEQUE Records
NOTE: Only person(s) with right to ‘view MGR CHQ transactions’ and ‘Download MGR CHQ transactions’ can carry out these operations.
STEP 1: Click on the download button on the MANAGER’s CHEQUE Explorer page. See Fig 33.3e for an example
(fig. 33.3e)
Clicking the download button will display a dropdown as in fig. 33.3f below
(fig. 33.3f)
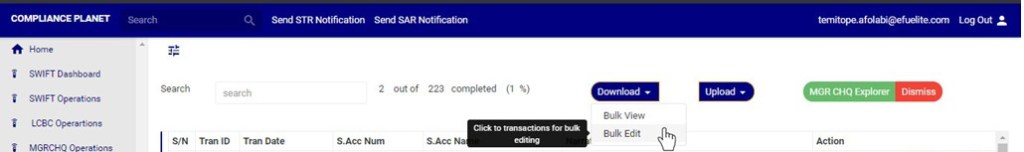
STEP 2: Click on the bulk Edit as shown in fig 33.3g below
(fig. 33.3g)
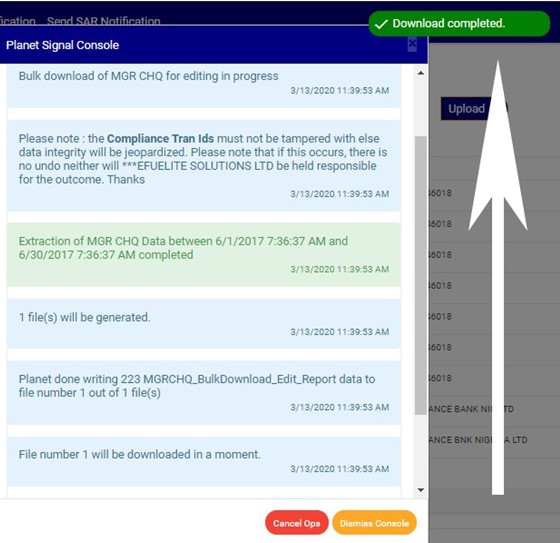
The signal console shows on going processes. An example of a signal console is fig 33.3d. You can terminate unfinished processes by clicking ‘CANCEL OPS’.
To minimize signal console, click on DISMISS CONSOLE.
(fig 33.3h)
An excel file with details of the Manager’s Cheque transaction will be downloaded when the process is complete. The data on the downloaded excel file can be edited and uploaded on the software to update multiple Manager’s transaction details at once. However, the ‘Compliance tran Id’ for each record on the excel file must not be tampered with for the upload to be successful.
How to make Bulk Upload of Edited Manager’s Cheque Documents
On the MGR CHQ operations page you can make a bulk upload of Edited Manager’s Cheque Transaction records. The process is explained below
NOTE: Only person(s) with right to ‘view MGR CHQ transactions’ and ‘Bulk Edit MGR CHQ transactions’ can carry out these operations.
STEP 1: Click the ‘Upload’ button on the Manager’s cheque Operation page. See Fig 33.3i for an example
(fig. 33.3i)
Clicking the Upload button will display a dropdown as in fig. 33.3j below
(Fig. 33.3j)
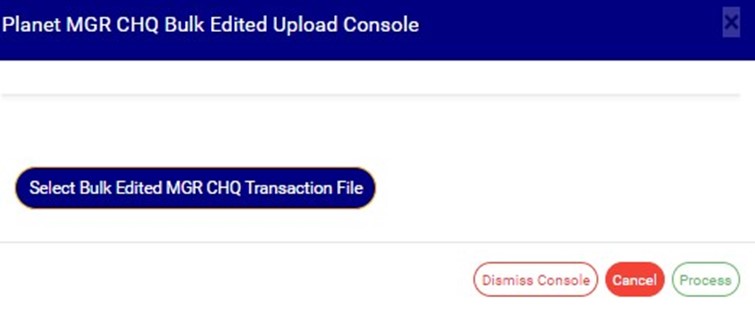
STEP 2: Click the bulk edited data as shown in fig 33.3j above, this will display a ‘Planet MGR CHQ Bulk Edited Upload Console’ as in Fig33.3k below.
(fig. 33.3k)
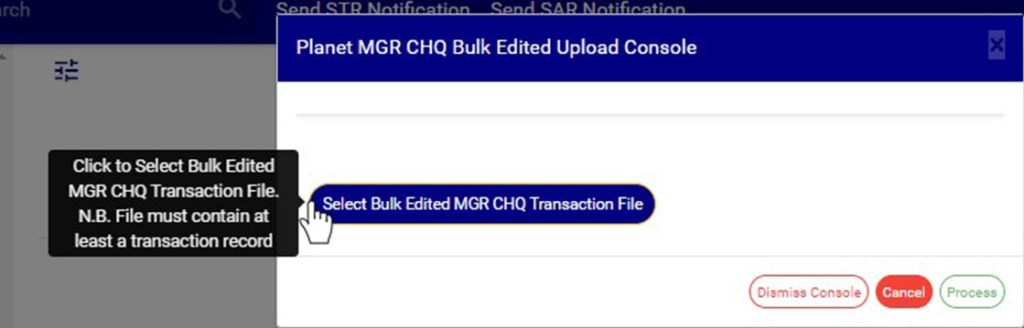
STEP 3: Click on ‘Select Bulk Edited MGR CHQ Transaction file’ to choose the edited transaction file you want to upload from your computer. See this in Fig 33.3l below
(fig. 33.3l)
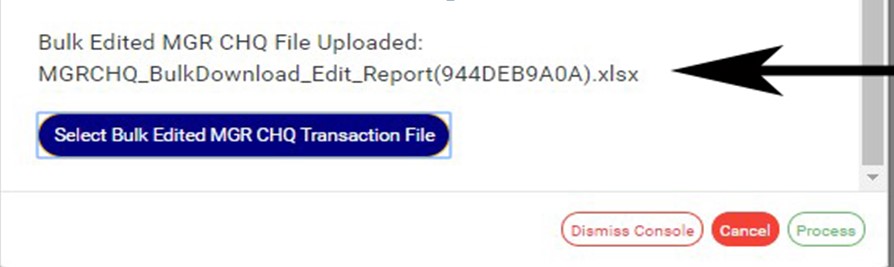
The file name will be displayed on the console when upload is successful .See fig. 33.3mfor an example of how the console looks like when you successfully upload a file from your computer.
(Fig. 33.3m)
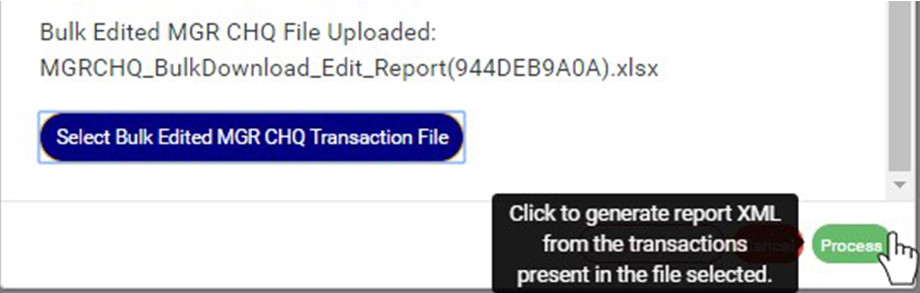
STEP 4: Click on ‘process’ button to proceed with the upload. See fig. 33.3n below to see the green button at the bottom-right corner of the console.
(Fig. 33.3n)
This displays a confirmation console as in fig. 33.3o below. Click ‘confirm’ to continue or ‘cancel’ to dismiss the operation.