This section provides a guide on how to use TM Account Explorer on the Compliance Planet Anti-Money Laundering/Core Banking Finance Software, including step-by-step instructions and illustrations.
STEP 1: From the app dashboard, click “DIGITAL FINANCIAL CRIMES SURVEILLANCE” as in Fig. a below.
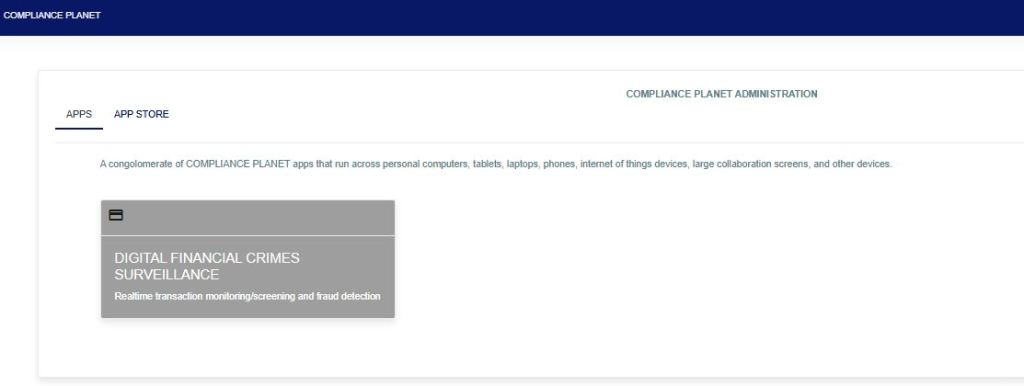
Fig a
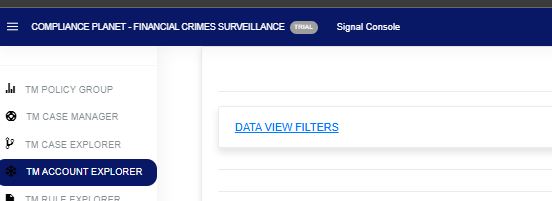
STEP 2: From the left-hand side menu, click “TM Account Explorer” as in Fig. b below.
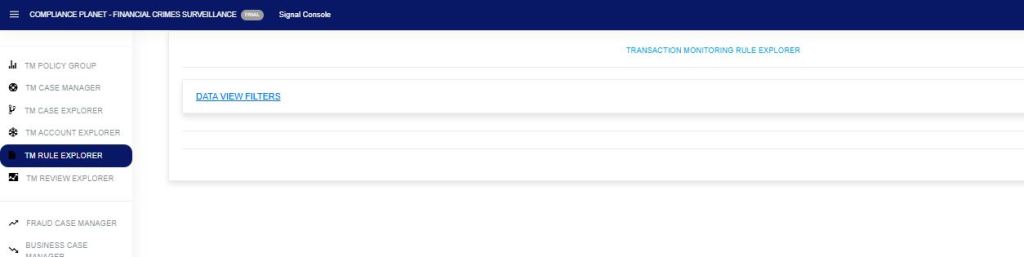
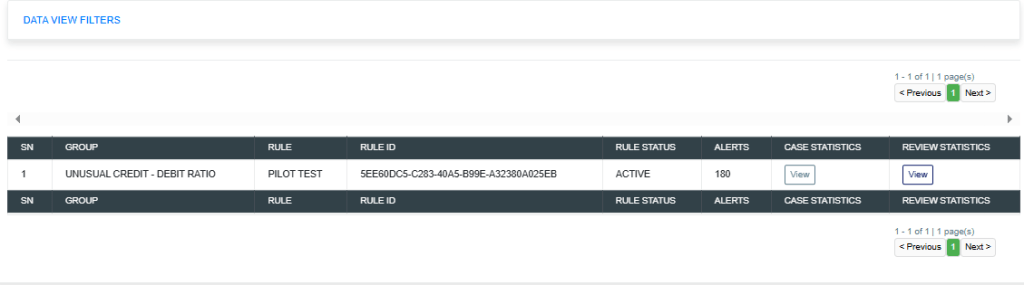
STEP 3: Click on the “Data View Filter” as in Fig. C below to open the sub-menu: Entries, Search, View (Export to Excel), Start Date, and End Date.
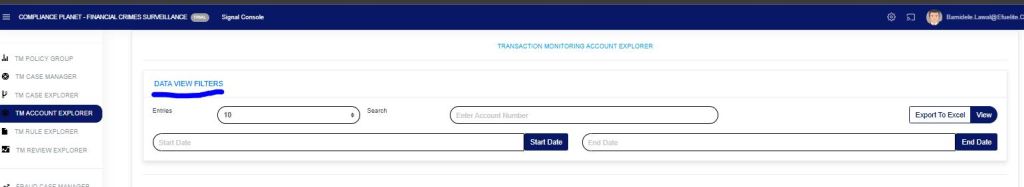
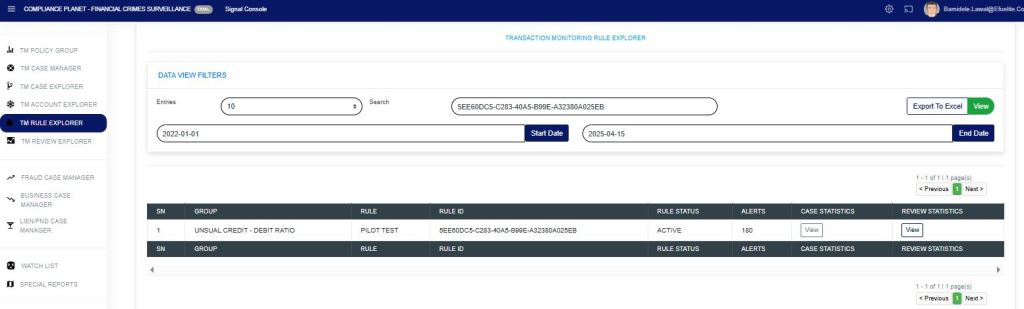
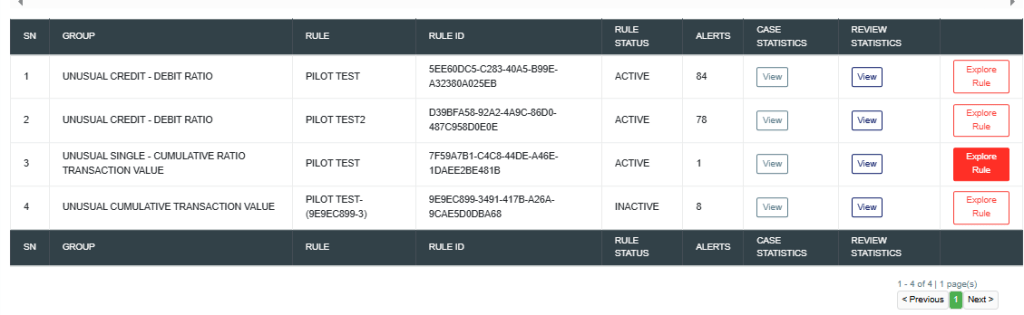
STEP 4: In the search bar, input the account number, Start Date, and End Date, then click View as in Fig. D below. This will display in detail every policy group and policy rule that the account has bridged.
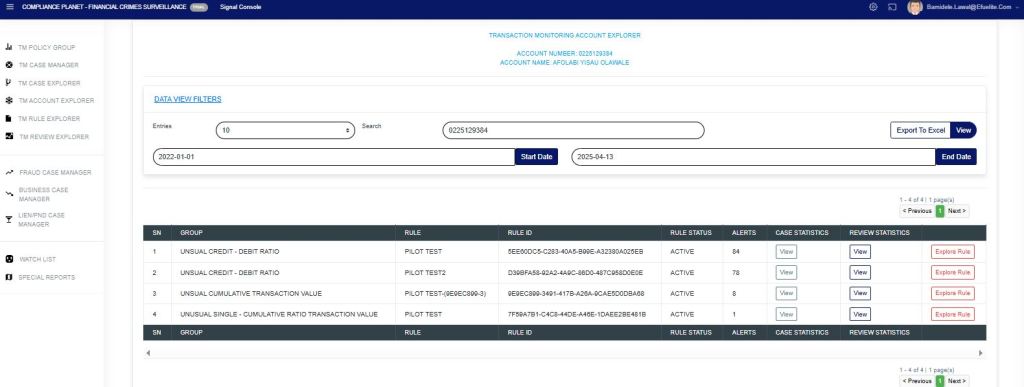
The “Alert” column displays the number of alerts captured within the specified date range for that account. This also displays other rule(s) the account has bridged within that same date range.
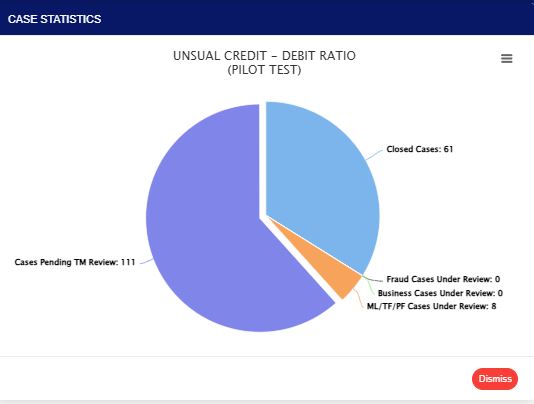
Click the View option under the case statistics column to show a visualization of the “case statistics“. All the cases pending TM review (shows the number of cases that are pending), closed cases (shows the number of cases that have been closed), fraud cases under review (shows the number of cases for fraud review), business cases under review (shows the number of cases for business review), and ML/TF/PF cases under review (shows the number of cases for STR review) within the date range specified as in Fig e below.
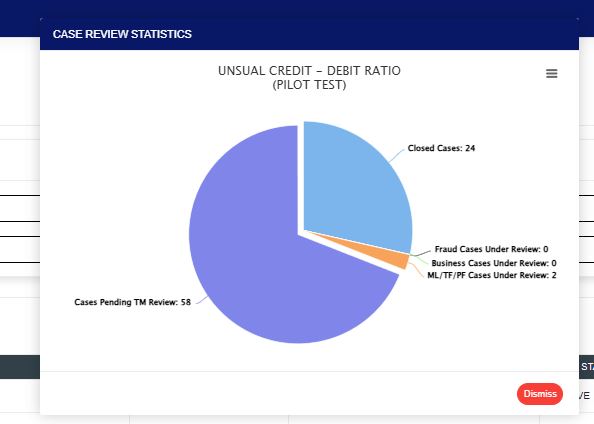
Fig e
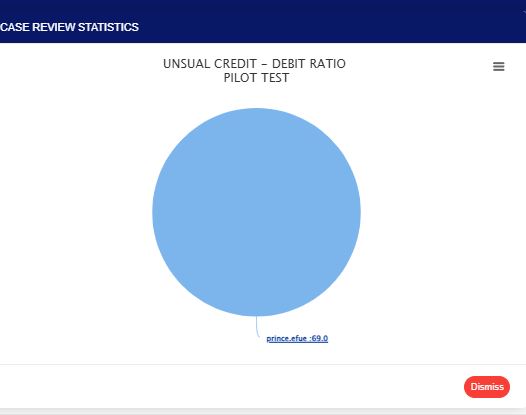
Click the view option under the review statistics column to show a visualization of the “review statistics“. This will display the policy name, the customer account name selected by the rule, and the account number. This also indicates the reviewer(s) and the number of times the rule has been reviewed out of the total number of alerts generated by the rule. Either the name of the reviewer (s) or the name of the policy with the number of reviewed actions, as in Fig. f below.
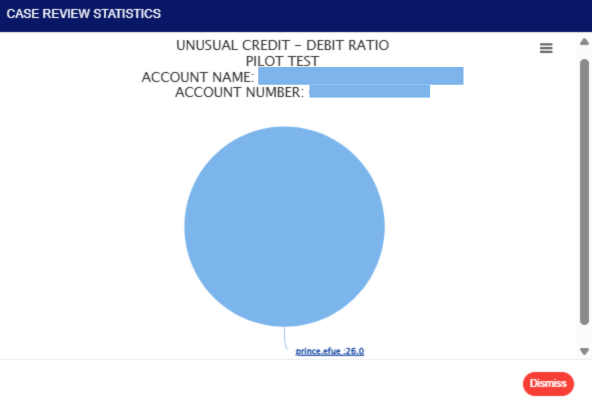
Fig f
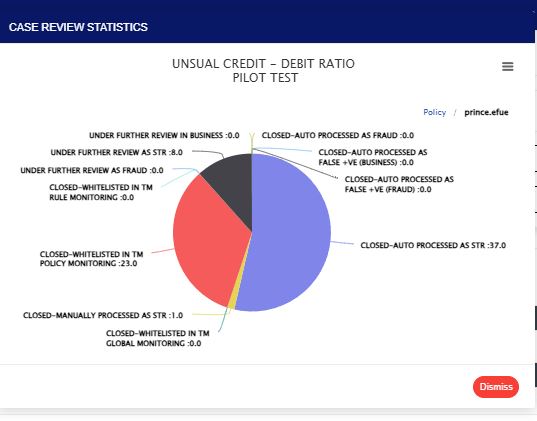
Clicking on the visualization chart will display detailed information on the review case, including figures as shown in Fig. g below, which illustrates how the reviewing personnel handled the review case. This includes cases manually closed by the reviewer, those auto-processed by the system and pushed to Fraud, those whitelisted, and those under review at different desks.
This provides a deeper insight into how cases were reviewed for a particular customer and the alerts generated by the rule within the specified date range.
When cases are pushed to STR for review and they are not closed, the alert will be pending on ML/TF/PF cases under review on the “case review statistics”.
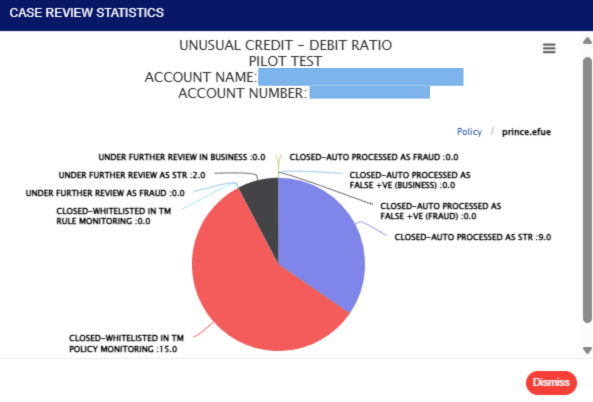
Fig g
This displays the reviewer’s name. Also, every action taken on the account under review.
Click on “Explore Rule” to display the TRANSACTION MONITORING RULE EXPLORER Page.
Click on “Explore Rule” to display the TRANSACTION MONITORING RULE EXPLORER as seen below.
For further inquiries:
Tel: +234(0) 816 555 9818
Email: solutions@efuelite.com
Web: http://solutions.efuelite.com